Concept explainers
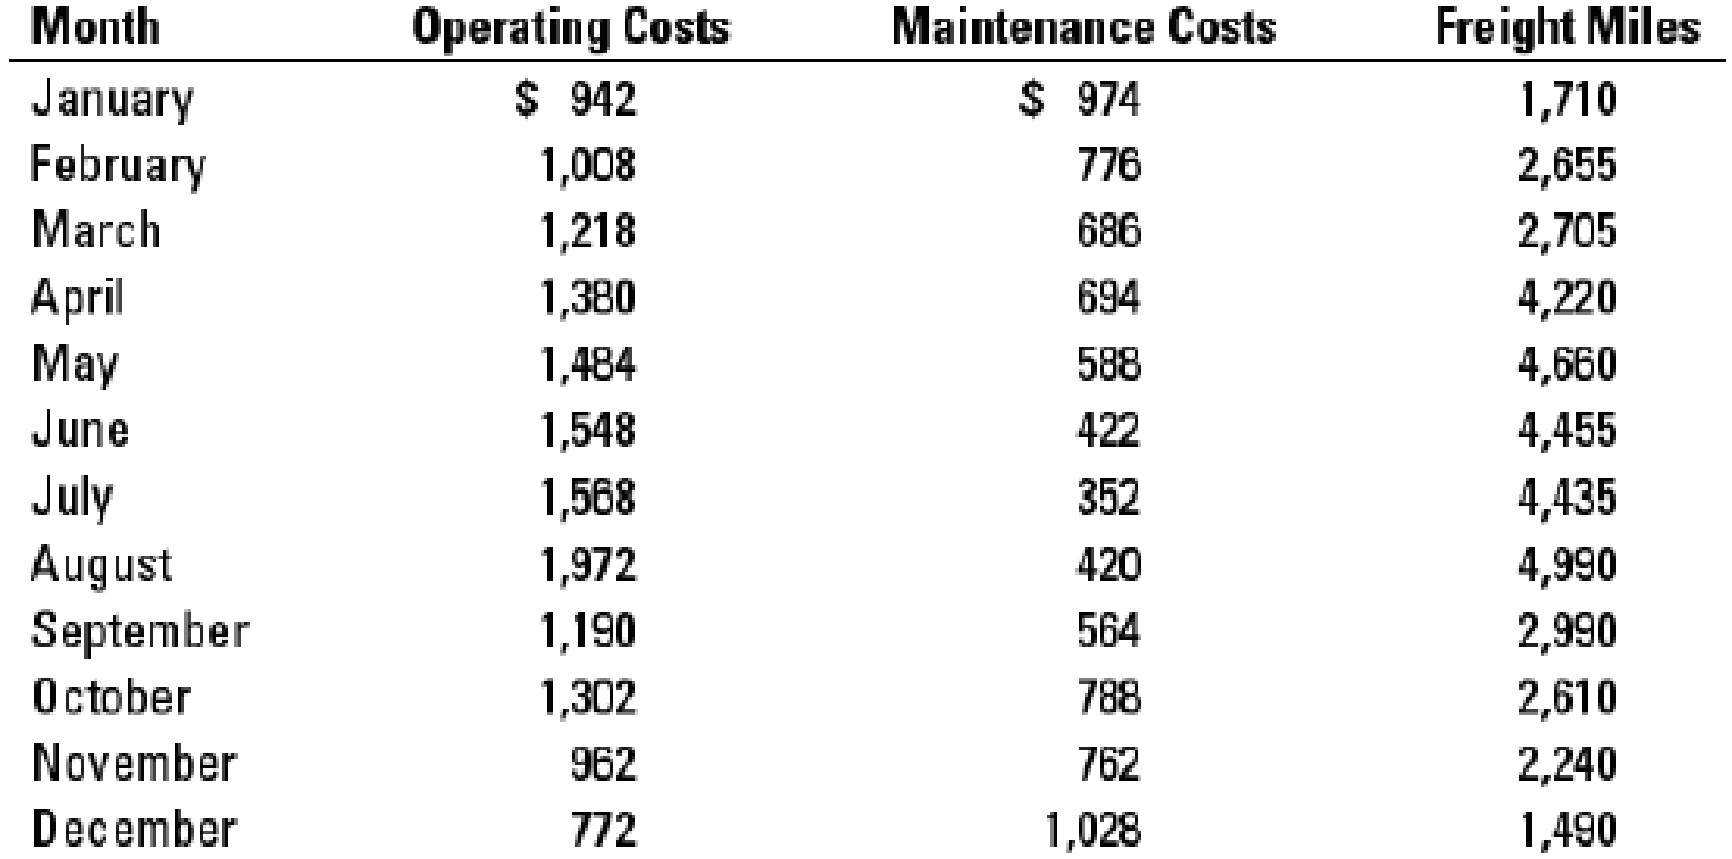
Interpreting regression results. Spirit Freightways is a leader in transporting agricultural products in the western provinces of Canada. Reese Brown, a financial analyst at Spirit Freightways, is studying the behavior of transportation costs for budgeting purposes. Transportation costs at Spirit are of two types: (a) operating costs (such as labor and fuel) and (b) maintenance costs (primarily overhaul of vehicles). Brown gathers monthly data on each type of cost, as well as the total freight miles traveled by Spirit vehicles in each month. The data collected are shown below (all in thousands):

- 1. Conduct a regression using the monthly data of operating costs on freight miles. You should obtain the following result:
Regression: Operating costs = a + (b × Number of freight miles)

- 2. Plot the data and regression line for the above estimation. Evaluate the regression using the criteria of economic plausibility, goodness of fit, and slope of the regression line.
- 3. Brown expects Spirit to generate, on average, 3,600 freight miles each month next year. How much in operating costs should Brown budget for next year?
- 4. Name three variables, other than freight miles, that Brown might expect to be important cost drivers for Spirit’s operating costs.
- 5. Brown next conducts a regression using the monthly data of maintenance costs on freight miles. Verify that she obtained the following result:
Regression: Maintenance costs = a + (b × Number of freight miles)

- 6. Provide a reasoned explanation for the observed sign on the cost driver variable in the maintenance cost regression. What alternative data or alternative regression specifications would you like to use to better capture the above relationship?
Want to see the full answer?
Check out a sample textbook solution
Chapter 10 Solutions
Horngren's Cost Accounting, Student Value Edition Plus MyLab Accounting with Pearson eText - Access Card Package (16th Edition)
- I need a expert not AI Step Amount Category Inventory 1. Beginning Balance, January 1 28,000 Beginning Balance Raw Materials 2. (+) Purchases (RM Purchases) 220,000 Addition Raw Materials 3. (-) Ending Balance 20,000 Ending Balance Raw Materials 4. = Transferred Out (RM used) (228,000) Transferred Out Raw Materials 5. (+) Direct Labor (152,000) Transferred Out Direct Labor 6. (+) Fixed Overhead 300,000 Addition Overhead 7. (+) Variable Overhead - Addition Overhead 8. = Total Factory Overhead (390,000) Transferred Out Overhead 9. Beginning Balance, January 1 40,000 Beginning Balance WIP 10. (+) Additions (RM used) 228,000 Addition WIP 11. (+) Additions (DL used) 152,000 Addition WIP 12. (+) Additions (OH used) 390,000 Addition WIP 13. (-) Ending Balance, December 31 55,000 Ending Balance WIP 14. = Transferred Out (COGM) (755,000)…arrow_forwardStep Amount Category Inventory 1. Beginning Balance, January 1 28,000 Beginning Balance Raw Materials 2. (+) Purchases (RM Purchases) 220,000 Addition Raw Materials 3. (-) Ending Balance 20,000 Ending Balance Raw Materials 4. = Transferred Out (RM used) (228,000) Transferred Out Raw Materials 5. (+) Direct Labor (152,000) Transferred Out Direct Labor 6. (+) Fixed Overhead 300,000 Addition Overhead 7. (+) Variable Overhead - Addition Overhead 8. = Total Factory Overhead (390,000) Transferred Out Overhead 9. Beginning Balance, January 1 40,000 Beginning Balance WIP 10. (+) Additions (RM used) 228,000 Addition WIP 11. (+) Additions (DL used) 152,000 Addition WIP 12. (+) Additions (OH used) 390,000 Addition WIP 13. (-) Ending Balance, December 31 55,000 Ending Balance WIP 14. = Transferred Out (COGM) (755,000) Transferred Out WIP 15.…arrow_forwardIntroduce yourself to your peers by sharing something unique about your background. Explain how you expect this course will help you move forward in your current or future career.arrow_forward
- Step Amount Category Inventory 1. Beginning Balance, January 1 28,000 Beginning Balance Raw Materials 2. (+) Purchases (RM Purchases) 220,000 Addition Raw Materials 3. (-) Ending Balance 20,000 Ending Balance Raw Materials 4. = Transferred Out (RM used) (228,000) Transferred Out Raw Materials 5. (+) Direct Labor (152,000) Transferred Out Direct Labor 6. (+) Fixed Overhead 300,000 Addition Overhead 7. (+) Variable Overhead - Addition Overhead 8. = Total Factory Overhead (390,000) Transferred Out Overhead 9. Beginning Balance, January 1 40,000 Beginning Balance WIP 10. (+) Additions (RM used) 228,000 Addition WIP 11. (+) Additions (DL used) 152,000 Addition WIP 12. (+) Additions (OH used) 390,000 Addition WIP 13. (-) Ending Balance, December 31 55,000 Ending Balance WIP 14. = Transferred Out (COGM) (755,000) Transferred Out WIP 15.…arrow_forward1. Beginning Balance, January 1 28,000 Beginning Balance Raw Materials 2. (+) Purchases (RM Purchases) 220,000 Addition Raw Materials 3. (-) Ending Balance 20,000 Ending Balance Raw Materials 4. = Transferred Out (RM used) (228,000) Transferred Out Raw Materials 5. (+) Direct Labor (152,000) Transferred Out Direct Labor 6. (+) Fixed Overhead 300,000 Addition Overhead 7. (+) Variable Overhead ? Addition Overhead 8. = Total Factory Overhead (390,000) Transferred Out Overhead 9. Beginning Balance, January 1 40,000 Beginning Balance WIP 10. (+) Additions (RM used) 228,000 Addition WIP 11. (+) Additions (DL used) 152,000 Addition WIP 12. (+) Additions (OH used) 390,000 Addition WIP 13. (-) Ending Balance, December 31 55,000 Ending Balance WIP 14. = Transferred Out (COGM) (755,000) Transferred Out WIP 15. Beginning Balance, January 1…arrow_forwardPalladium, Incorporated recently lost a portion of its records in an office fire. The following information was salvaged from the accounting records. Cost of Goods Sold $ 67,000 Work-in-Process Inventory, Beginning 11,300 Work-in-Process Inventory, Ending 9,400 Selling and Administrative Expense 16,000 Finished Goods Inventory, Ending 16,100 Finished Goods Inventory, Beginning ?question mark Direct Materials Used ?question mark Factory Overhead Applied 12,400 Operating Income 14,220 Direct Materials Inventory, Beginning 11,180 Direct Materials Inventory, Ending 6,140 Cost of Goods Manufactured 61,880 Direct labor cost incurred during the period amounted to 1.5 times the factory overhead. The Chief Financial Officer of Palladium, Incorporated has asked you to recalculate the following accounts and to report to him by the end of the day. What is the amount in the finished goods inventory at the beginning of the year?arrow_forward
- Which of the following statements is incorrect regarding manufacturing overhead? Multiple Choice Manufacturing overhead includes both fixed and variable costs. Manufacturing overhead is an indirect cost to units or products. Actual overhead costs are used in the cost accounting process. Actual overhead costs tend to remain relatively constant over various output levels.arrow_forwardPalladium, Incorporated recently lost a portion of its records in an office fire. The following information was salvaged from the accounting records. Cost of Goods Sold $ 72,500 Work-in-Process Inventory, Beginning 13,500 Work-in-Process Inventory, Ending 10,500 Selling and Administrative Expense 18,750 Finished Goods Inventory, Ending 19,125 Finished Goods Inventory, Beginning ?question mark Direct Materials Used ?question mark Factory Overhead Applied 13,500 Operating Income 14,825 Direct Materials Inventory, Beginning 11,675 Direct Materials Inventory, Ending 6,525 Cost of Goods Manufactured 67,050 Direct labor cost incurred during the period amounted to 1.5 times the factory overhead. The Chief Financial Officer of Palladium, Incorporated has asked you to recalculate the following accounts and to report to him by the end of the day. What is the amount of direct materials purchased?arrow_forwardOn December 31, 2022, Akron, Incorporated, purchased 5 percent of Zip Company's common shares on the open market in exchange for $15,650. On December 31, 2023, Akron, Incorporated, acquires an additional 25 percent of Zip Company's outstanding common stock for $93,500. During the next two years, the following information is available for Zip Company: Year Income Dividends Declared Common Stock Fair Value (12/31) 2022 $ 313,000 2023 $ 70,000 $ 7,800 374,000 2024 90,000 15,100 476,000 At December 31, 2023, Zip reports a net book value of $294,000. Akron attributed any excess of its 30 percent share of Zip's fair over book value to its share of Zip's franchise agreements. The franchise agreements had a remaining life of 10 years at December 31, 2023. Required: Assume Akron applies the equity method to its Investment in Zip account: What amount of equity income should Akron report for 2024? On Akron's December 31, 2024, balance sheet, what amount is reported for the…arrow_forward
 Essentials of Business Analytics (MindTap Course ...StatisticsISBN:9781305627734Author:Jeffrey D. Camm, James J. Cochran, Michael J. Fry, Jeffrey W. Ohlmann, David R. AndersonPublisher:Cengage Learning
 Cornerstones of Cost Management (Cornerstones Ser...AccountingISBN:9781305970663Author:Don R. Hansen, Maryanne M. MowenPublisher:Cengage Learning
 Principles of Cost AccountingAccountingISBN:9781305087408Author:Edward J. Vanderbeck, Maria R. MitchellPublisher:Cengage Learning
- Principles of Accounting Volume 2AccountingISBN:9781947172609Author:OpenStaxPublisher:OpenStax College
 Excel Applications for Accounting PrinciplesAccountingISBN:9781111581565Author:Gaylord N. SmithPublisher:Cengage Learning


