Concept explainers
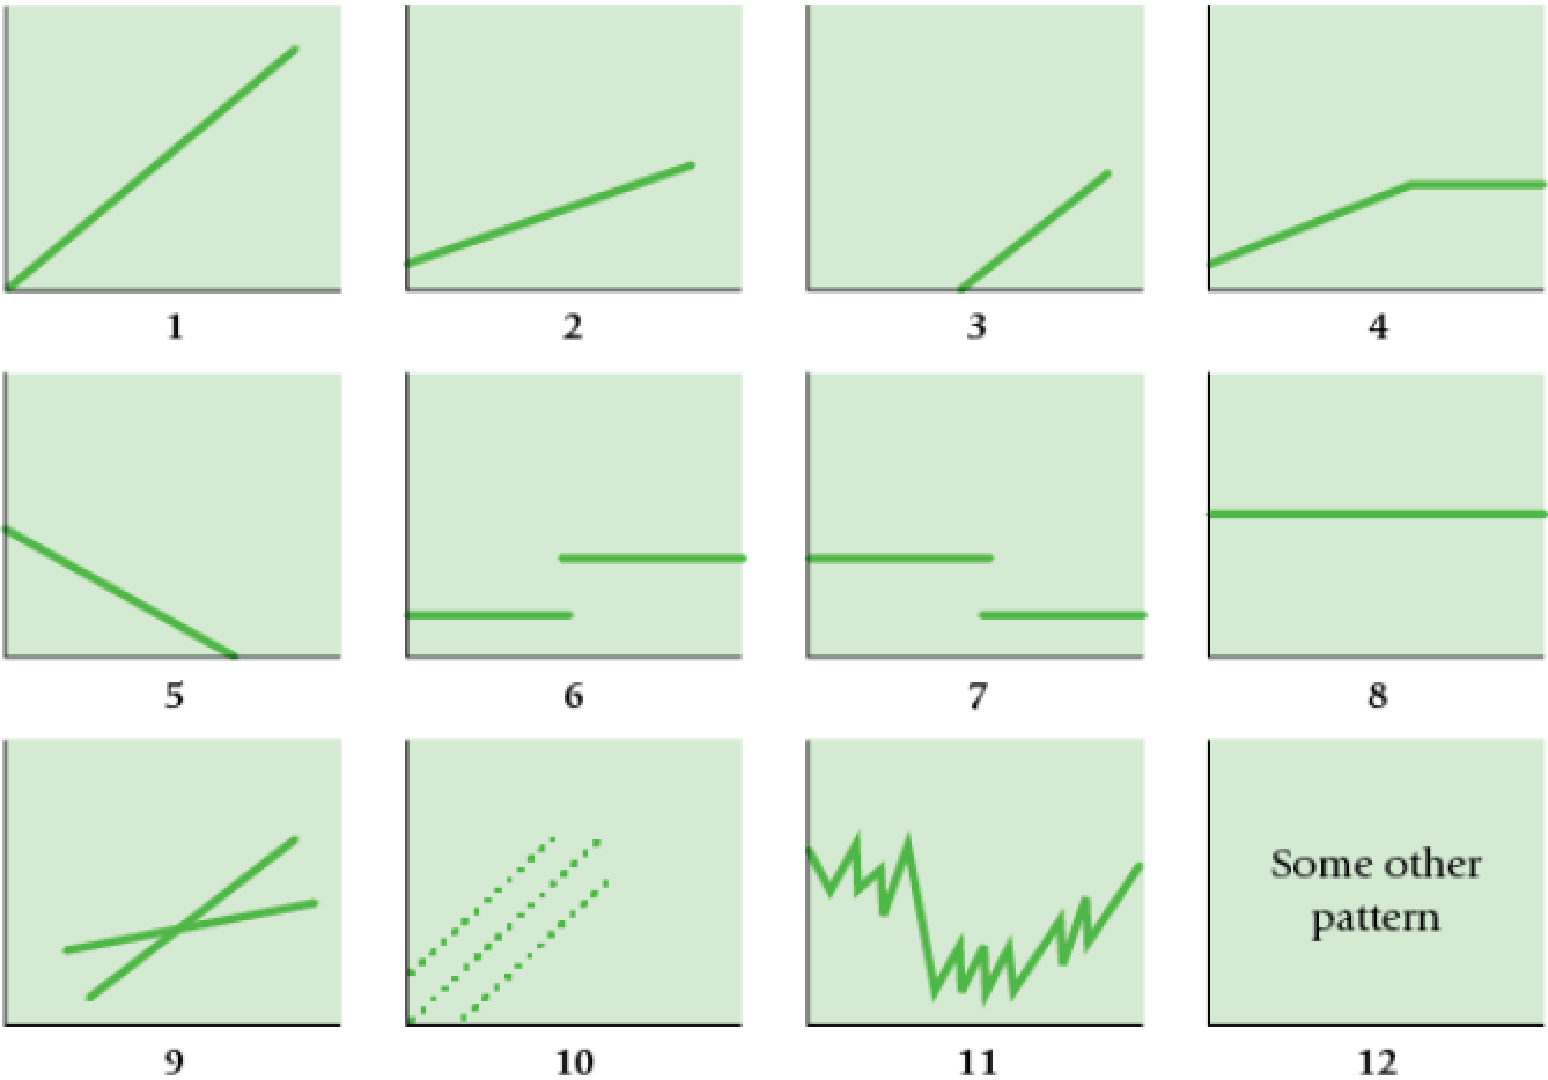
Matching graphs with descriptions of cost and revenue behavior. (D. Green, adapted) Given here are a number of graphs.

The horizontal axis of each graph represents the units produced over the year, and the vertical axis represents total cost or revenues.
Indicate by number which graph best fits the situation or item described (a–h). Some graphs may be used more than once; some may not apply to any of the situations.
Required
- a. Direct material costs
- b. Supervisors’ salaries for one shift and two shifts
- c. A cost–volume–profit graph
- d. Mixed costs—for example, car rental fixed charge plus a rate per mile driven
- e.
Depreciation of plant, computed on a straight-line basis - f. Data supporting the use of a variable-cost rate, such as
manufacturing labor cost of $14 per unit produced - g. Incentive bonus plan that pays managers $0.10 for every unit produced above some level of production
- h. Interest expense on $2 million borrowed at a fixed rate of interest
Learn your wayIncludes step-by-step video

Chapter 10 Solutions
Horngren's Cost Accounting, Student Value Edition (16th Edition)
Additional Business Textbook Solutions
Financial Accounting (12th Edition) (What's New in Accounting)
Fundamentals of Management (10th Edition)
Financial Accounting, Student Value Edition (5th Edition)
Horngren's Financial & Managerial Accounting, The Financial Chapters (Book & Access Card)
Gitman: Principl Manageri Finance_15 (15th Edition) (What's New in Finance)
- Consider the following project which costs $2,000 with a salvage value of zero in 4 years. The project will produce a new widget which will be sold for $140 and has variable costs of $110 per unit. The company has fixed costs of $3,050 and a required return on projects of 14.5%. If the company sells 210 units, what is the firm's degree of leverage?arrow_forwardFinancial Accountingarrow_forwardNonearrow_forward
- What were the total sales for the year ?arrow_forwardMia Vision Clinic is considering an investment that required an outlay of $505,000 and promises a net cash inflow one year from now of $660,000. Assume the cost of capital is 13 percent. Break the $550,000 future cash inflow into three components: 1. The cost of capital. 2. The profit earned on the investment. Accounting Problem need solutionarrow_forwardSolve this financial accounting problemarrow_forward
 Principles of Cost AccountingAccountingISBN:9781305087408Author:Edward J. Vanderbeck, Maria R. MitchellPublisher:Cengage Learning
 Managerial Accounting: The Cornerstone of Busines...AccountingISBN:9781337115773Author:Maryanne M. Mowen, Don R. Hansen, Dan L. HeitgerPublisher:Cengage Learning
 Managerial AccountingAccountingISBN:9781337912020Author:Carl Warren, Ph.d. Cma William B. TaylerPublisher:South-Western College Pub
 Financial And Managerial AccountingAccountingISBN:9781337902663Author:WARREN, Carl S.Publisher:Cengage Learning,
 Financial & Managerial AccountingAccountingISBN:9781285866307Author:Carl Warren, James M. Reeve, Jonathan DuchacPublisher:Cengage Learning
 Excel Applications for Accounting PrinciplesAccountingISBN:9781111581565Author:Gaylord N. SmithPublisher:Cengage Learning


