
Concept explainers
Videos
In Exercises 1−4. (a) identify the claim and state H0 and Ha, (b) find the critical value and identify the rejection region, (c) find the chi-square test statistic, (d) decide whether to reject or fail to reject the null hypothesis, and (e) interpret the decision in the context of the original claim.
1. A researcher claims that the distribution of the lengths of visits at physician offices is different from the distribution shown in the pie chart. You randomly select 400 people and ask them how long their office visits with a physician were. The table shows the results. At a = 0.01, test the researcher’s claim, (Adapted from Medscape)
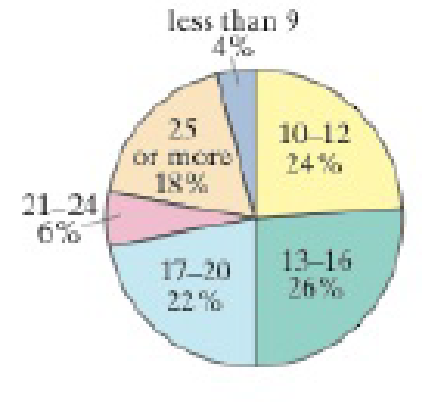
| Survey results | |
| Minutes | Frequence, f |
| less than 9 | 20 |
| 10−12 | 80 |
| 13−16 | 113 |
| 17−20 | 91 |
| 21−24 | 40 |
| 25 or more | 56 |
a.
To identify: The claim.
To state: The hypothesis
Answer to Problem 10.1.1RE
The claim is that, the distribution of the lengths differs from the expected distribution.
The hypothesis
Explanation of Solution
Given info:
The data shows the results of the distribution of the lengths of the visits at physician offices.
Calculation:
Here, the distribution of the lengths differs from the expected distribution is tested. Hence, the claim is that the distribution of the lengths differs from the expected distribution.
The hypotheses are given below:
Null hypothesis:
Alternative hypothesis:
b.
To obtain: The critical value.
To identify: The rejection region.
Answer to Problem 10.1.1RE
The critical value is 15.086.
The rejection region is
Explanation of Solution
Given info:
The level of significance is 0.01.
Calculation:
Critical value:
The critical value is calculated by using the
Substitute k as 6 in degrees of freedom.
From the Table 6-Chi-Square Distribution, the critical value for 5 degrees of freedom for
Rejection region:
The null hypothesis would be rejected if
Thus, the rejection region is
c.
To obtain: The chi-square test statistic.
Answer to Problem 10.1.1RE
The chi-square test statistic is 18.770.
Explanation of Solution
Calculation:
Step by step procedure to obtain chi-square test statistic using the MINITAB software:
- Choose Stat > Tables > Chi-Square Goodness-of-Fit Test (One Variable).
- In Observed counts, enter the column of Frequency.
- In Category names, enter the column of Minutes.
- Under Test, select the column of Proportions in Proportions specified by historical counts.
- Click OK.
Output using the MINITAB software is given below:
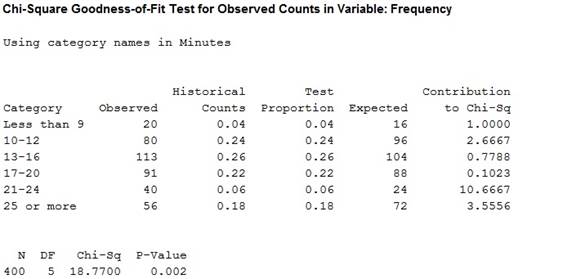
Thus, the chi-square test statistic value is approximately 18.770.
d.
To check: Whether the null hypothesis is rejected or fails to reject.
Answer to Problem 10.1.1RE
The null hypothesis is rejected.
Explanation of Solution
Conclusion:
From the result of (c), the test-statistic value is 18.770.
Here, the chi-square test statistic value is greater than the critical value.
That is,
Thus, it can be conclude that the null hypothesis is rejected.
e.
To interpret: The decision in the context of the original claim.
Answer to Problem 10.1.1RE
The conclusion is that, there is evidence to support the claim that the distribution of the lengths differs from the expected distribution.
Explanation of Solution
Interpretation:
From the results of part (d), it can be conclude that there is evidence to support the claim that the distribution of the lengths differs from the expected distribution.
Want to see more full solutions like this?
Chapter 10 Solutions
ELEMENTARY STATISTICS W/MYMATHLAB<CUSTM


- I need help with this problem and an explanation of the solution for the image described below. (Statistics: Engineering Probabilities)arrow_forward310015 K Question 9, 5.2.28-T Part 1 of 4 HW Score: 85.96%, 49 of 57 points Points: 1 Save of 6 Based on a poll, among adults who regret getting tattoos, 28% say that they were too young when they got their tattoos. Assume that six adults who regret getting tattoos are randomly selected, and find the indicated probability. Complete parts (a) through (d) below. a. Find the probability that none of the selected adults say that they were too young to get tattoos. 0.0520 (Round to four decimal places as needed.) Clear all Final check Feb 7 12:47 US Oarrow_forwardhow could the bar graph have been organized differently to make it easier to compare opinion changes within political partiesarrow_forward
- 30. An individual who has automobile insurance from a certain company is randomly selected. Let Y be the num- ber of moving violations for which the individual was cited during the last 3 years. The pmf of Y isy | 1 2 4 8 16p(y) | .05 .10 .35 .40 .10 a.Compute E(Y).b. Suppose an individual with Y violations incurs a surcharge of $100Y^2. Calculate the expected amount of the surcharge.arrow_forward24. An insurance company offers its policyholders a num- ber of different premium payment options. For a ran- domly selected policyholder, let X = the number of months between successive payments. The cdf of X is as follows: F(x)=0.00 : x < 10.30 : 1≤x<30.40 : 3≤ x < 40.45 : 4≤ x <60.60 : 6≤ x < 121.00 : 12≤ x a. What is the pmf of X?b. Using just the cdf, compute P(3≤ X ≤6) and P(4≤ X).arrow_forward59. At a certain gas station, 40% of the customers use regular gas (A1), 35% use plus gas (A2), and 25% use premium (A3). Of those customers using regular gas, only 30% fill their tanks (event B). Of those customers using plus, 60% fill their tanks, whereas of those using premium, 50% fill their tanks.a. What is the probability that the next customer will request plus gas and fill the tank (A2 B)?b. What is the probability that the next customer fills the tank?c. If the next customer fills the tank, what is the probability that regular gas is requested? Plus? Premium?arrow_forward
- 38. Possible values of X, the number of components in a system submitted for repair that must be replaced, are 1, 2, 3, and 4 with corresponding probabilities .15, .35, .35, and .15, respectively. a. Calculate E(X) and then E(5 - X).b. Would the repair facility be better off charging a flat fee of $75 or else the amount $[150/(5 - X)]? [Note: It is not generally true that E(c/Y) = c/E(Y).]arrow_forward74. The proportions of blood phenotypes in the U.S. popula- tion are as follows:A B AB O .40 .11 .04 .45 Assuming that the phenotypes of two randomly selected individuals are independent of one another, what is the probability that both phenotypes are O? What is the probability that the phenotypes of two randomly selected individuals match?arrow_forward53. A certain shop repairs both audio and video compo- nents. Let A denote the event that the next component brought in for repair is an audio component, and let B be the event that the next component is a compact disc player (so the event B is contained in A). Suppose that P(A) = .6 and P(B) = .05. What is P(BA)?arrow_forward
 College Algebra (MindTap Course List)AlgebraISBN:9781305652231Author:R. David Gustafson, Jeff HughesPublisher:Cengage Learning
 Glencoe Algebra 1, Student Edition, 9780079039897...AlgebraISBN:9780079039897Author:CarterPublisher:McGraw Hill
 Holt Mcdougal Larson Pre-algebra: Student Edition...AlgebraISBN:9780547587776Author:HOLT MCDOUGALPublisher:HOLT MCDOUGAL
 Big Ideas Math A Bridge To Success Algebra 1: Stu...AlgebraISBN:9781680331141Author:HOUGHTON MIFFLIN HARCOURTPublisher:Houghton Mifflin Harcourt