
Concept explainers
Videos
In Exercises 1−4. (a) identify the claim and state H0 and Ha, (b) find the critical value and identify the rejection region, (c) find the chi-square test statistic, (d) decide whether to reject or fail to reject the null hypothesis, and (e) interpret the decision in the context of the original claim.
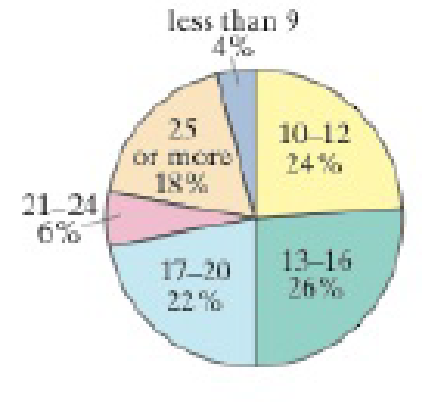
1. A researcher claims that the distribution of the lengths of visits at physician offices is different from the distribution shown in the pie chart. You randomly select 400 people and ask them how long their office visits with a physician were. The table shows the results. At a = 0.01, test the researcher’s claim, (Adapted from Medscape)
| Survey results | |
| Minutes | Frequence, f |
| less than 9 | 20 |
| 10−12 | 80 |
| 13−16 | 113 |
| 17−20 | 91 |
| 21−24 | 40 |
| 25 or more | 56 |
a.
To identify: The claim.
To state: The hypothesis
Answer to Problem 10.1.1RE
The claim is that, the distribution of the lengths differs from the expected distribution.
The hypothesis
Explanation of Solution
Given info:
The data shows the results of the distribution of the lengths of the visits at physician offices.
Calculation:
Here, the distribution of the lengths differs from the expected distribution is tested. Hence, the claim is that the distribution of the lengths differs from the expected distribution.
The hypotheses are given below:
Null hypothesis:
Alternative hypothesis:
b.
To obtain: The critical value.
To identify: The rejection region.
Answer to Problem 10.1.1RE
The critical value is 15.086.
The rejection region is
Explanation of Solution
Given info:
The level of significance is 0.01.
Calculation:
Critical value:
The critical value is calculated by using the
Substitute k as 6 in degrees of freedom.
From the Table 6-Chi-Square Distribution, the critical value for 5 degrees of freedom for
Rejection region:
The null hypothesis would be rejected if
Thus, the rejection region is
c.
To obtain: The chi-square test statistic.
Answer to Problem 10.1.1RE
The chi-square test statistic is 18.770.
Explanation of Solution
Calculation:
Step by step procedure to obtain chi-square test statistic using the MINITAB software:
- Choose Stat > Tables > Chi-Square Goodness-of-Fit Test (One Variable).
- In Observed counts, enter the column of Frequency.
- In Category names, enter the column of Minutes.
- Under Test, select the column of Proportions in Proportions specified by historical counts.
- Click OK.
Output using the MINITAB software is given below:
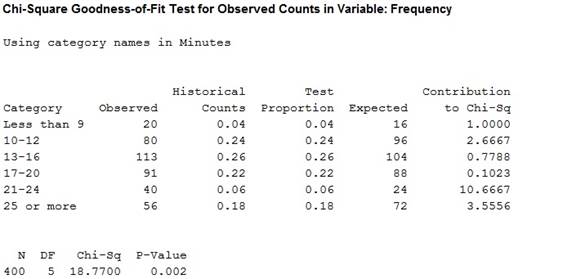
Thus, the chi-square test statistic value is approximately 18.770.
d.
To check: Whether the null hypothesis is rejected or fails to reject.
Answer to Problem 10.1.1RE
The null hypothesis is rejected.
Explanation of Solution
Conclusion:
From the result of (c), the test-statistic value is 18.770.
Here, the chi-square test statistic value is greater than the critical value.
That is,
Thus, it can be conclude that the null hypothesis is rejected.
e.
To interpret: The decision in the context of the original claim.
Answer to Problem 10.1.1RE
The conclusion is that, there is evidence to support the claim that the distribution of the lengths differs from the expected distribution.
Explanation of Solution
Interpretation:
From the results of part (d), it can be conclude that there is evidence to support the claim that the distribution of the lengths differs from the expected distribution.
Want to see more full solutions like this?
Chapter 10 Solutions
Elementary Statistics: Picturing the World, Books a la Carte Edition (7th Edition)


- T1.4: Let ẞ(G) be the minimum size of a vertex cover, a(G) be the maximum size of an independent set and m(G) = |E(G)|. (i) Prove that if G is triangle free (no induced K3) then m(G) ≤ a(G)B(G). Hints - The neighborhood of a vertex in a triangle free graph must be independent; all edges have at least one end in a vertex cover. (ii) Show that all graphs of order n ≥ 3 and size m> [n2/4] contain a triangle. Hints - you may need to use either elementary calculus or the arithmetic-geometric mean inequality.arrow_forwardWe consider the one-period model studied in class as an example. Namely, we assumethat the current stock price is S0 = 10. At time T, the stock has either moved up toSt = 12 (with probability p = 0.6) or down towards St = 8 (with probability 1−p = 0.4).We consider a call option on this stock with maturity T and strike price K = 10. Theinterest rate on the money market is zero.As in class, we assume that you, as a customer, are willing to buy the call option on100 shares of stock for $120. The investor, who sold you the option, can adopt one of thefollowing strategies: Strategy 1: (seen in class) Buy 50 shares of stock and borrow $380. Strategy 2: Buy 55 shares of stock and borrow $430. Strategy 3: Buy 60 shares of stock and borrow $480. Strategy 4: Buy 40 shares of stock and borrow $280.(a) For each of strategies 2-4, describe the value of the investor’s portfolio at time 0,and at time T for each possible movement of the stock.(b) For each of strategies 2-4, does the investor have…arrow_forwardNegate the following compound statement using De Morgans's laws.arrow_forward
- Negate the following compound statement using De Morgans's laws.arrow_forwardQuestion 6: Negate the following compound statements, using De Morgan's laws. A) If Alberta was under water entirely then there should be no fossil of mammals.arrow_forwardNegate the following compound statement using De Morgans's laws.arrow_forward
- Characterize (with proof) all connected graphs that contain no even cycles in terms oftheir blocks.arrow_forwardLet G be a connected graph that does not have P4 or C3 as an induced subgraph (i.e.,G is P4, C3 free). Prove that G is a complete bipartite grapharrow_forwardProve sufficiency of the condition for a graph to be bipartite that is, prove that if G hasno odd cycles then G is bipartite as follows:Assume that the statement is false and that G is an edge minimal counterexample. That is, Gsatisfies the conditions and is not bipartite but G − e is bipartite for any edge e. (Note thatthis is essentially induction, just using different terminology.) What does minimality say aboutconnectivity of G? Can G − e be disconnected? Explain why if there is an edge between twovertices in the same part of a bipartition of G − e then there is an odd cyclearrow_forward
 College Algebra (MindTap Course List)AlgebraISBN:9781305652231Author:R. David Gustafson, Jeff HughesPublisher:Cengage Learning
 Glencoe Algebra 1, Student Edition, 9780079039897...AlgebraISBN:9780079039897Author:CarterPublisher:McGraw Hill
 Holt Mcdougal Larson Pre-algebra: Student Edition...AlgebraISBN:9780547587776Author:HOLT MCDOUGALPublisher:HOLT MCDOUGAL
 Big Ideas Math A Bridge To Success Algebra 1: Stu...AlgebraISBN:9781680331141Author:HOUGHTON MIFFLIN HARCOURTPublisher:Houghton Mifflin Harcourt