
Concept explainers
Videos
In Exercises 1−4. (a) identify the claim and state H0 and Ha, (b) find the critical value and identify the rejection region, (c) find the chi-square test statistic, (d) decide whether to reject or fail to reject the null hypothesis, and (e) interpret the decision in the context of the original claim.
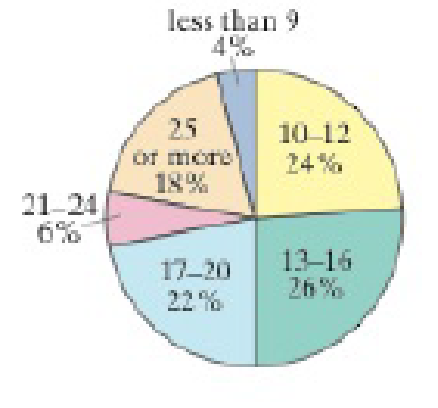
2. A researcher claims that the distribution of the amounts that parents give for an allowance is different from the distribution shown in the pie chart. You randomly select 1103 parents and ask them how much they give for an allowance. The table shows the results. At α = 0.10, test the researcher’s claim. (Adapted from Echo Research)
| Survey results | |
| Response | Frequency, f |
| Less than $10 | 353 |
| $10 to $20 | 167 |
| More than $21 | 94 |
| Don't give one/other | 489 |
a.
To identify: The claim.
To state: The hypothesis
Answer to Problem 10.1.1RE
The claim is that, the distribution of amounts differs from the expected distribution.
The hypothesis
Explanation of Solution
Given info:
The data shows the results of the distribution of the amounts that parent give for allowance.
Calculation:
Here, the distribution of amounts differs from the expected distribution is tested. Hence, the claim is that the distribution of amounts differs from the expected distribution.
The hypotheses are given below:
Null hypothesis:
Alternative hypothesis:
b.
To obtain: The critical value.
To identify: The rejection region.
Answer to Problem 10.1.1RE
The critical value is 6.251.
The rejection region is
Explanation of Solution
Given info:
The level of significance is 0.10.
Calculation:
Critical value:
The critical value is calculated by using the
Substitute k as 4 in degrees of freedom.
From the Table 6-Chi-Square Distribution, the critical value for 3 degrees of freedom for
Rejection region:
The null hypothesis would be rejected if
Thus, the rejection region is
c.
To obtain: The chi-square test statistic.
Answer to Problem 10.1.1RE
The chi-square test statistic is 4.886.
Explanation of Solution
Calculation:
Step by step procedure to obtain chi-square test statistic using the MINITAB software:
- Choose Stat > Tables > Chi-Square Goodness-of-Fit Test (One Variable).
- In Observed counts, enter the column of Frequency.
- In Category names, enter the column of Response.
- Under Test, select the column of Proportions in Proportions specified by historical counts.
- Click OK.
Output using the MINITAB software is given below:
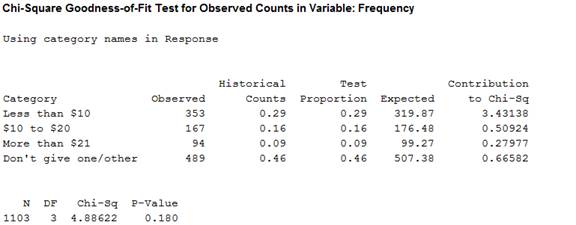
Thus, the chi-square test statistic value is approximately 4.886.
d.
To check: Whether the null hypothesis is rejected or fails to reject.
Answer to Problem 10.1.1RE
The null hypothesis is fails to reject.
Explanation of Solution
Conclusion:
From the result of (c), the test-statistic value is 4.886.
Here, the chi-square test statistic value is lesser than the critical value.
That is,
Thus, it can be conclude that the null hypothesis fails to reject.
e.
To interpret: The decision in the context of the original claim.
Answer to Problem 10.1.1RE
The conclusion is that, there is no evidence to support the claim that the distribution of amounts differs from the expected distribution.
Explanation of Solution
Interpretation:
From the results of part (d), it can be conclude that there is no evidence to support the claim that the distribution of amounts differs from the expected distribution.
Want to see more full solutions like this?
Chapter 10 Solutions
Elementary Statistics: Picturing the World (6th Edition)


- What do you guess are the standard deviations of the two distributions in the previous example problem?arrow_forwardPlease answer the questionsarrow_forward30. An individual who has automobile insurance from a certain company is randomly selected. Let Y be the num- ber of moving violations for which the individual was cited during the last 3 years. The pmf of Y isy | 1 2 4 8 16p(y) | .05 .10 .35 .40 .10 a.Compute E(Y).b. Suppose an individual with Y violations incurs a surcharge of $100Y^2. Calculate the expected amount of the surcharge.arrow_forward
- 24. An insurance company offers its policyholders a num- ber of different premium payment options. For a ran- domly selected policyholder, let X = the number of months between successive payments. The cdf of X is as follows: F(x)=0.00 : x < 10.30 : 1≤x<30.40 : 3≤ x < 40.45 : 4≤ x <60.60 : 6≤ x < 121.00 : 12≤ x a. What is the pmf of X?b. Using just the cdf, compute P(3≤ X ≤6) and P(4≤ X).arrow_forward59. At a certain gas station, 40% of the customers use regular gas (A1), 35% use plus gas (A2), and 25% use premium (A3). Of those customers using regular gas, only 30% fill their tanks (event B). Of those customers using plus, 60% fill their tanks, whereas of those using premium, 50% fill their tanks.a. What is the probability that the next customer will request plus gas and fill the tank (A2 B)?b. What is the probability that the next customer fills the tank?c. If the next customer fills the tank, what is the probability that regular gas is requested? Plus? Premium?arrow_forward38. Possible values of X, the number of components in a system submitted for repair that must be replaced, are 1, 2, 3, and 4 with corresponding probabilities .15, .35, .35, and .15, respectively. a. Calculate E(X) and then E(5 - X).b. Would the repair facility be better off charging a flat fee of $75 or else the amount $[150/(5 - X)]? [Note: It is not generally true that E(c/Y) = c/E(Y).]arrow_forward
- 74. The proportions of blood phenotypes in the U.S. popula- tion are as follows:A B AB O .40 .11 .04 .45 Assuming that the phenotypes of two randomly selected individuals are independent of one another, what is the probability that both phenotypes are O? What is the probability that the phenotypes of two randomly selected individuals match?arrow_forward53. A certain shop repairs both audio and video compo- nents. Let A denote the event that the next component brought in for repair is an audio component, and let B be the event that the next component is a compact disc player (so the event B is contained in A). Suppose that P(A) = .6 and P(B) = .05. What is P(BA)?arrow_forward26. A certain system can experience three different types of defects. Let A;(i = 1,2,3) denote the event that the sys- tem has a defect of type i. Suppose thatP(A1) = .12 P(A) = .07 P(A) = .05P(A, U A2) = .13P(A, U A3) = .14P(A2 U A3) = .10P(A, A2 A3) = .011Rshelfa. What is the probability that the system does not havea type 1 defect?b. What is the probability that the system has both type 1 and type 2 defects?c. What is the probability that the system has both type 1 and type 2 defects but not a type 3 defect? d. What is the probability that the system has at most two of these defects?arrow_forward
- The following are suggested designs for group sequential studies. Using PROCSEQDESIGN, provide the following for the design O’Brien Fleming and Pocock.• The critical boundary values for each analysis of the data• The expected sample sizes at each interim analysisAssume the standardized Z score method for calculating boundaries.Investigators are evaluating the success rate of a novel drug for treating a certain type ofbacterial wound infection. Since no existing treatment exists, they have planned a one-armstudy. They wish to test whether the success rate of the drug is better than 50%, whichthey have defined as the null success rate. Preliminary testing has estimated the successrate of the drug at 55%. The investigators are eager to get the drug into production andwould like to plan for 9 interim analyses (10 analyzes in total) of the data. Assume thesignificance level is 5% and power is 90%.Besides, draw a combined boundary plot (OBF, POC, and HP)arrow_forwardPlease provide the solution for the attached image in detailed.arrow_forward20 km, because GISS Worksheet 10 Jesse runs a small business selling and delivering mealie meal to the spaza shops. He charges a fixed rate of R80, 00 for delivery and then R15, 50 for each packet of mealle meal he delivers. The table below helps him to calculate what to charge his customers. 10 20 30 40 50 Packets of mealie meal (m) Total costs in Rands 80 235 390 545 700 855 (c) 10.1. Define the following terms: 10.1.1. Independent Variables 10.1.2. Dependent Variables 10.2. 10.3. 10.4. 10.5. Determine the independent and dependent variables. Are the variables in this scenario discrete or continuous values? Explain What shape do you expect the graph to be? Why? Draw a graph on the graph provided to represent the information in the table above. TOTAL COST OF PACKETS OF MEALIE MEAL 900 800 700 600 COST (R) 500 400 300 200 100 0 10 20 30 40 60 NUMBER OF PACKETS OF MEALIE MEALarrow_forward
 College Algebra (MindTap Course List)AlgebraISBN:9781305652231Author:R. David Gustafson, Jeff HughesPublisher:Cengage Learning
 Glencoe Algebra 1, Student Edition, 9780079039897...AlgebraISBN:9780079039897Author:CarterPublisher:McGraw Hill
 Holt Mcdougal Larson Pre-algebra: Student Edition...AlgebraISBN:9780547587776Author:HOLT MCDOUGALPublisher:HOLT MCDOUGAL