
(a)
Interpretation:
The least square analysis needs to be performed to determine the intercept, slopeand regression statistics, including the standard deviation about regression.
Concept introduction:
The least square analysis is defined as the method in which the final answer for the set of data points is calculated by the minimizing the summation of residue of set of data point from the given curve.
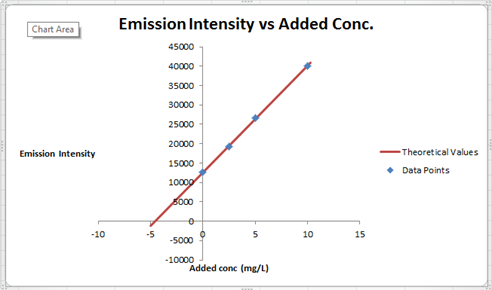
The equation for straight line is represented as follows:
Answer to Problem 10.11QAP
To satisfy the equation
Explanation of Solution
Least Square Analysis

The summary of calculation is as follows.
| Added Au | Emission Intensity (y) | ||
| 0 | 12568 | ||
| 2.5 | 19324 | ||
| 5 | 26622 | ||
| 10 | 40021 | ||
| m | c | 2752.72 | 12590.6 |
| sm | sb | 30.7796445 | 176.3126 |
| r2 | sy | 0.99975001 | 227.6185 |
Here, the sigma values focus on the errors present in the parameter.
So far, we have filled
Now, we must determine the concentration of gold and its uncertainty. The concentration of gold is x. intercept of the graph, because that is the point at which the gold is absence so the difference between that and the zero added point must be the gold concentration in sample.
Now, x is a function of c and m. Thus, the uncertainty in them will be propagated to x as well. We have the following since m and c are independent.
x = x(m,c)
By propagation of uncertainty,
This is, however, the standard error. Assuming the distribution of value to be normal about the value of x, this value would give an interval of 63.5% probability. However, if we want a 95% probability interval, we will have to multiply the error in x by 1.96.
(b)
Interpretation:
The concentration of gold in the sample solution in mg/L needs to be determined using the calculated values.
Concept introduction:
The least square analysis is defined as the method in which the final answer for the set of data points is calculated by the minimizing the summation of residue of set of data point from the given curve.
The equation for straight line is represented as follows:
Answer to Problem 10.11QAP
Concentration of gold in sample =
Explanation of Solution
Least Square Analysis
The summary of calculation is as follows.
| Added Au | Emission Intensity (y) | ||
| 0 | 12568 | ||
| 2.5 | 19324 | ||
| 5 | 26622 | ||
| 10 | 40021 | ||
| m | c | 2752.72 | 12590.6 |
| sm | sb | 30.7796445 | 176.3126 |
| r2 | sy | 0.99975001 | 227.6185 |
Here, the sigma values focus on the errors present in the parameter.
So far, we have filled
Now, we must determine the concentration of gold and its uncertainty. The concentration of gold is x. intercept of the graph, because that is the point at which the gold is absence so the difference between that and the zero added point must be the gold concentration in sample.
Now, x is a function of c and m. Thus, the uncertainty in them will be propagated to x as well. We have the following since m and c are independent.
x = x(m,c)
By propagation of uncertainty,
This is however, the standard error. Assuming the distribution of value to be normal about the value of x, this value would give an interval of 63.5% probability. However, if we want a 95% probability interval, we will have to multiply the error in x by 1.96.
Concentration of gold in sample =
(c)
Interpretation:
The concentration of gold in the sample is 8.51 mg/L needs to be determined and the hypothesis that the results equals the 95% confidence level needs to be tested.
Concept introduction:
The least square analysis is defined as the method in which the final answer for the set of data points is calculated by the minimizing the summation of residue of set of data point from the given curve.
The equation for straight line is represented as follows:
Answer to Problem 10.11QAP
Considering a confidence interval of 95% we have concentration of
Explanation of Solution
Least Square Analysis

The summary of calculation is as follows.
| Added Au | Emission Intensity (y) | ||
| 0 | 12568 | ||
| 2.5 | 19324 | ||
| 5 | 26622 | ||
| 10 | 40021 | ||
| m | c | 2752.72 | 12590.6 |
| sm | sb | 30.7796445 | 176.3126 |
| r2 | sy | 0.99975001 | 227.6185 |
Here, the sigma values focus on the errors present in the parameter.
So far, we have filled
Now, we must determine the concentration of gold and its uncertainty. The concentration of gold is x. intercept of the graph, because that is the point at which the gold is absence so the difference between that and the zero added point must be the gold concentration in sample.
Now, x is a function of c and m. Thus, the uncertainty in them will be propagated to x as well. We have the following since m and c are independent.
x = x(m,c)
By propagation of uncertainty,
This is however, the standard error. Assuming the distribution of value to be normal about the value of x, this value would give an interval of 63.5% probability. However, if we want a 95% probability interval, we will have to multiply the error in x by 1.96.
Considering a confidence interval of 95% we have concentration of
Want to see more full solutions like this?
Chapter 10 Solutions
Principles of Instrumental Analysis, 6th Edition

- Indicate the products obtained by mixing acetophenone with iodine and NaOH.arrow_forwardIndicate the products obtained by mixing 2-Propanone and ethyllithium and performing a subsequent acid hydrolysis.arrow_forwardIndicate the products obtained if (E)-2-butenal and 3-oxo-butanenitrile are mixed with sodium ethoxide in ethanol.arrow_forward
- Question 3 (4 points), Draw a full arrow-pushing mechanism for the following reaction Please draw all structures clearly. Note that this intramolecular cyclization is analogous to the mechanism for halohydrin formation. COH Br + HBr Brarrow_forwardIndicate the products obtained if 2,2-dimethylpropanal and acetaldehyde are mixed with sodium ethoxide in ethanol.arrow_forwardIndicate the products obtained if 2,2-dimethylpropanal and acetaldehyde are reacted with sodium ethoxide in ethanol.arrow_forward
- 2,2-Dimethylpropanal and acetaldehyde are reacted with sodium ethoxide in ethanol. Indicate the products obtained.arrow_forwardAdd conditions above and below the arrow that turn the reactant below into the product below in a single transformationADS fint anditions 百 Abl res condinese NC ง Add on condtions 1.0 B H,N.arrow_forward3. Provide all the steps and reagents for this synthesis. OHarrow_forward
 Chemistry: Principles and PracticeChemistryISBN:9780534420123Author:Daniel L. Reger, Scott R. Goode, David W. Ball, Edward MercerPublisher:Cengage Learning
 Chemistry & Chemical ReactivityChemistryISBN:9781337399074Author:John C. Kotz, Paul M. Treichel, John Townsend, David TreichelPublisher:Cengage Learning
 Chemistry & Chemical ReactivityChemistryISBN:9781133949640Author:John C. Kotz, Paul M. Treichel, John Townsend, David TreichelPublisher:Cengage Learning