
Introductory Statistics Plus Mylab Statistics With Pearson Etext -- Access Card Package (3rd Edition)
3rd Edition
ISBN: 9780135229996
Author: Robert Gould, Rebecca Wong, Colleen N. Ryan
Publisher: PEARSON
expand_more
expand_more
format_list_bulleted
Videos
Textbook Question
Chapter 1, Problem 6SE
The data in Table 1A were collected from one of the authors’ statistics classes. The first row gives the variable, and each of the other rows represents a student in the class.
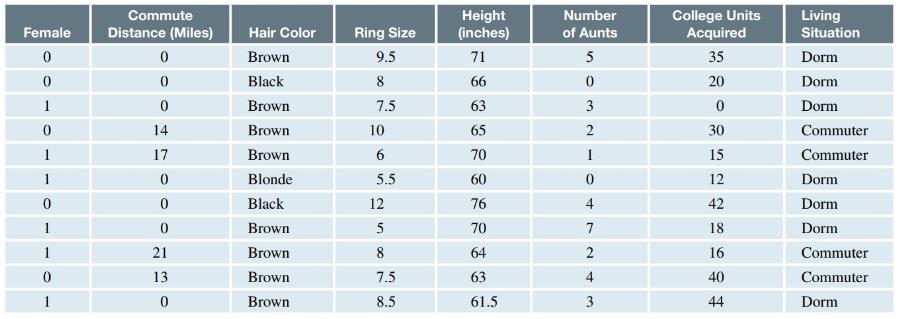
TABLE 1A
Give an example of another categorical variable we might have recorded for the students whose data are in Table 1A?
Expert Solution & Answer

Learn your wayIncludes step-by-step video

schedule01:25
Students have asked these similar questions
Q.2.4 There are twelve (12) teams participating in a pub quiz. What is the probability of correctly predicting the top three teams at the end of the competition, in the correct order? Give your final answer as a fraction in its simplest form.
The table below indicates the number of years of experience of a sample of employees who work on a particular production line and the corresponding number of units of a good that each employee produced last month.
Years of Experience (x)
Number of Goods (y)
11
63
5
57
1
48
4
54
5
45
3
51
Q.1.1 By completing the table below and then applying the relevant formulae, determine the line of best fit for this bivariate data set.
Do NOT change the units for the variables.
X
y
X2
xy
Ex=
Ey=
EX2
EXY=
Q.1.2 Estimate the number of units of the good that would have been produced last month by an employee with 8 years of experience.
Q.1.3 Using your calculator, determine the coefficient of correlation for the data set.
Interpret your answer.
Q.1.4 Compute the coefficient of determination for the data set.
Interpret your answer.
Can you answer this question for me
Chapter 1 Solutions
Introductory Statistics Plus Mylab Statistics With Pearson Etext -- Access Card Package (3rd Edition)
Ch. 1 - The data in Table 1A were collected from one of...Ch. 1 - The data in Table 1A were collected from one of...Ch. 1 - The data in Table 1A were collected from one of...Ch. 1 - The data in Table 1A were collected from one of...Ch. 1 - The data in Table 1A were collected from one of...Ch. 1 - The data in Table 1A were collected from one of...Ch. 1 - The data in Table 1A were collected from one of...Ch. 1 - Coding Suppose you decided to code living...Ch. 1 - The data in Table 1A were collected from one of...Ch. 1 - Coding Students who have accumulated fewer than 30...
Ch. 1 - Facebook Wall Posts (Example 2) A student shared...Ch. 1 - Age of Marriage A student did a survey on the age...Ch. 1 - Snacks Emmanuel, a student at a Los Angeles high...Ch. 1 - Movies A sample of students were questioned to...Ch. 1 - Use the data in Table 1A to answer questions 1.15...Ch. 1 - Use the data in Table 1A to answer questions 1.15...Ch. 1 - Use the data in Table 1A to answer questions 1.15...Ch. 1 - Use the data in Table 1A to answer questions 1.15...Ch. 1 - Investigating Data (Example 4) A data set on Shark...Ch. 1 - Investigating Data Suppose a surfer wanted to...Ch. 1 - Hands (Example 5) A survey was done of men’s and...Ch. 1 - Hands-Biased A survey was done of men’s and...Ch. 1 - Finding and Using Percentages a. A statistics...Ch. 1 - Finding and Using Percentages a. A hospital...Ch. 1 - Women Find the frequency, proportion, and...Ch. 1 - Brown-Haired People Find the frequency,...Ch. 1 - Two-Way Table from Data Make a two-way table from...Ch. 1 - Two-Way Table from Data Make a two-way table from...Ch. 1 - Occupation Growth (Example 6) The 2017 World...Ch. 1 - Chocolate Sales The 2017 World Almanac and Book of...Ch. 1 - Incarceration Rates (Example 7) The table gives...Ch. 1 - Population Density The accompanying table gives...Ch. 1 - Health Insurance The accompanying table gives the...Ch. 1 - Cable TV Subscriptions The accompanying table...Ch. 1 - Percentage of Elderly The projected U.S....Ch. 1 - Marriage and Divorce The marriage and divorce...Ch. 1 - Course Enrollment Rates Two sections of statistics...Ch. 1 - Prob. 38SECh. 1 - For Exercises 1.39 through 1.44, indicate whether...Ch. 1 - For Exercises 1.39 through 1.44, indicate whether...Ch. 1 - For Exercises 1.39 through 1.44, indicate whether...Ch. 1 - For Exercises 1.39 through 1.44, indicate whether...Ch. 1 - For Exercises 1.39 through 1.44, indicate whether...Ch. 1 - For Exercises 1.39 through 1.44, indicate whether...Ch. 1 - Vitamin C and Cancer The blog NHS Choices...Ch. 1 - Aloe Vera You can find many testimonials on the...Ch. 1 - Effects of Tutoring on Math Grades (Example 8) A...Ch. 1 - Treating Depression A doctor who believes strongly...Ch. 1 - Try Exercise and Language Learning (Example 9) In...Ch. 1 - Pneumonia Vaccine for Young Children A study...Ch. 1 - Does Fish Oil Lower Asthma Risk? The New England...Ch. 1 - Association between Glycemic Load and Acne? An...Ch. 1 - Milk and Cartilage (Example 10) Cartilage is a...Ch. 1 - Autism and MMR Vaccine An article by Wakefield et...Ch. 1 - Prob. 55SECh. 1 - Effect of Confederates on Compliance A study was...Ch. 1 - A Salad a Day Keeps Stroke Away? The Harvard Heart...Ch. 1 - Does Drinking Sugary Beverages Lead to Dementia?...Ch. 1 - Secondhand Smoke Exposure and Young Children...Ch. 1 - Prob. 60CRECh. 1 - Speeding Tickets College students who were drivers...Ch. 1 - Prob. 62CRECh. 1 - Writing: Vitamin D Describe the design of a...Ch. 1 - Writing: Strokes People who have had strokes are...Ch. 1 - Yoga and High-Risk Adolescents Can mindful yoga...Ch. 1 - Neurofeedback and ADHD Some studies have indicated...Ch. 1 - Virtual Reality and Fall Risk A study was...Ch. 1 - Ear Infections Babies 6 to 23 months of age with...Ch. 1 - Effects of Light Exposure A study carried out by...Ch. 1 - Scared Straight The idea of sending delinquents to...
Additional Math Textbook Solutions
Find more solutions based on key concepts
In Exercises 21-24, use these results from the “1-Panel-THC” test for marijuana use, which is provided by the c...
Elementary Statistics (13th Edition)
A Bloomberg Businessweek subscriber study asked, In the past 12 months, when travelling for business, what type...
STATISTICS F/BUSINESS+ECONOMICS-TEXT
Identifying Type I and Type II Errors In Exercises 31–36, describe type I and type II errors for a hypothesis t...
Elementary Statistics: Picturing the World (7th Edition)
4. Correlation and Causation What is meant by the statement that “correlation does imply causation”?
Elementary Statistics
the given ordered pair
Pre-Algebra Student Edition
Knowledge Booster


Learn more about
Need a deep-dive on the concept behind this application? Look no further. Learn more about this topic, statistics and related others by exploring similar questions and additional content below.Similar questions
- Techniques QUAT6221 2025 PT B... TM Tabudi Maphoru Activities Assessments Class Progress lIE Library • Help v The table below shows the prices (R) and quantities (kg) of rice, meat and potatoes items bought during 2013 and 2014: 2013 2014 P1Qo PoQo Q1Po P1Q1 Price Ро Quantity Qo Price P1 Quantity Q1 Rice 7 80 6 70 480 560 490 420 Meat 30 50 35 60 1 750 1 500 1 800 2 100 Potatoes 3 100 3 100 300 300 300 300 TOTAL 40 230 44 230 2 530 2 360 2 590 2 820 Instructions: 1 Corall dawn to tha bottom of thir ceraan urina se se tha haca nariad in archerca antarand cubmit Q Search ENG US 口X 2025/05arrow_forwardThe table below indicates the number of years of experience of a sample of employees who work on a particular production line and the corresponding number of units of a good that each employee produced last month. Years of Experience (x) Number of Goods (y) 11 63 5 57 1 48 4 54 45 3 51 Q.1.1 By completing the table below and then applying the relevant formulae, determine the line of best fit for this bivariate data set. Do NOT change the units for the variables. X y X2 xy Ex= Ey= EX2 EXY= Q.1.2 Estimate the number of units of the good that would have been produced last month by an employee with 8 years of experience. Q.1.3 Using your calculator, determine the coefficient of correlation for the data set. Interpret your answer. Q.1.4 Compute the coefficient of determination for the data set. Interpret your answer.arrow_forwardQ.3.2 A sample of consumers was asked to name their favourite fruit. The results regarding the popularity of the different fruits are given in the following table. Type of Fruit Number of Consumers Banana 25 Apple 20 Orange 5 TOTAL 50 Draw a bar chart to graphically illustrate the results given in the table.arrow_forward
- Q.2.3 The probability that a randomly selected employee of Company Z is female is 0.75. The probability that an employee of the same company works in the Production department, given that the employee is female, is 0.25. What is the probability that a randomly selected employee of the company will be female and will work in the Production department? Q.2.4 There are twelve (12) teams participating in a pub quiz. What is the probability of correctly predicting the top three teams at the end of the competition, in the correct order? Give your final answer as a fraction in its simplest form.arrow_forwardQ.2.1 A bag contains 13 red and 9 green marbles. You are asked to select two (2) marbles from the bag. The first marble selected will not be placed back into the bag. Q.2.1.1 Construct a probability tree to indicate the various possible outcomes and their probabilities (as fractions). Q.2.1.2 What is the probability that the two selected marbles will be the same colour? Q.2.2 The following contingency table gives the results of a sample survey of South African male and female respondents with regard to their preferred brand of sports watch: PREFERRED BRAND OF SPORTS WATCH Samsung Apple Garmin TOTAL No. of Females 30 100 40 170 No. of Males 75 125 80 280 TOTAL 105 225 120 450 Q.2.2.1 What is the probability of randomly selecting a respondent from the sample who prefers Garmin? Q.2.2.2 What is the probability of randomly selecting a respondent from the sample who is not female? Q.2.2.3 What is the probability of randomly…arrow_forwardTest the claim that a student's pulse rate is different when taking a quiz than attending a regular class. The mean pulse rate difference is 2.7 with 10 students. Use a significance level of 0.005. Pulse rate difference(Quiz - Lecture) 2 -1 5 -8 1 20 15 -4 9 -12arrow_forward
- The following ordered data list shows the data speeds for cell phones used by a telephone company at an airport: A. Calculate the Measures of Central Tendency from the ungrouped data list. B. Group the data in an appropriate frequency table. C. Calculate the Measures of Central Tendency using the table in point B. D. Are there differences in the measurements obtained in A and C? Why (give at least one justified reason)? I leave the answers to A and B to resolve the remaining two. 0.8 1.4 1.8 1.9 3.2 3.6 4.5 4.5 4.6 6.2 6.5 7.7 7.9 9.9 10.2 10.3 10.9 11.1 11.1 11.6 11.8 12.0 13.1 13.5 13.7 14.1 14.2 14.7 15.0 15.1 15.5 15.8 16.0 17.5 18.2 20.2 21.1 21.5 22.2 22.4 23.1 24.5 25.7 28.5 34.6 38.5 43.0 55.6 71.3 77.8 A. Measures of Central Tendency We are to calculate: Mean, Median, Mode The data (already ordered) is: 0.8, 1.4, 1.8, 1.9, 3.2, 3.6, 4.5, 4.5, 4.6, 6.2, 6.5, 7.7, 7.9, 9.9, 10.2, 10.3, 10.9, 11.1, 11.1, 11.6, 11.8, 12.0, 13.1, 13.5, 13.7, 14.1, 14.2, 14.7, 15.0, 15.1, 15.5,…arrow_forwardPEER REPLY 1: Choose a classmate's Main Post. 1. Indicate a range of values for the independent variable (x) that is reasonable based on the data provided. 2. Explain what the predicted range of dependent values should be based on the range of independent values.arrow_forwardIn a company with 80 employees, 60 earn $10.00 per hour and 20 earn $13.00 per hour. Is this average hourly wage considered representative?arrow_forward
- The following is a list of questions answered correctly on an exam. Calculate the Measures of Central Tendency from the ungrouped data list. NUMBER OF QUESTIONS ANSWERED CORRECTLY ON AN APTITUDE EXAM 112 72 69 97 107 73 92 76 86 73 126 128 118 127 124 82 104 132 134 83 92 108 96 100 92 115 76 91 102 81 95 141 81 80 106 84 119 113 98 75 68 98 115 106 95 100 85 94 106 119arrow_forwardThe following ordered data list shows the data speeds for cell phones used by a telephone company at an airport: A. Calculate the Measures of Central Tendency using the table in point B. B. Are there differences in the measurements obtained in A and C? Why (give at least one justified reason)? 0.8 1.4 1.8 1.9 3.2 3.6 4.5 4.5 4.6 6.2 6.5 7.7 7.9 9.9 10.2 10.3 10.9 11.1 11.1 11.6 11.8 12.0 13.1 13.5 13.7 14.1 14.2 14.7 15.0 15.1 15.5 15.8 16.0 17.5 18.2 20.2 21.1 21.5 22.2 22.4 23.1 24.5 25.7 28.5 34.6 38.5 43.0 55.6 71.3 77.8arrow_forwardIn a company with 80 employees, 60 earn $10.00 per hour and 20 earn $13.00 per hour. a) Determine the average hourly wage. b) In part a), is the same answer obtained if the 60 employees have an average wage of $10.00 per hour? Prove your answer.arrow_forward
arrow_back_ios
SEE MORE QUESTIONS
arrow_forward_ios
Recommended textbooks for you
 Holt Mcdougal Larson Pre-algebra: Student Edition...AlgebraISBN:9780547587776Author:HOLT MCDOUGALPublisher:HOLT MCDOUGAL
 Big Ideas Math A Bridge To Success Algebra 1: Stu...AlgebraISBN:9781680331141Author:HOUGHTON MIFFLIN HARCOURTPublisher:Houghton Mifflin Harcourt
 Glencoe Algebra 1, Student Edition, 9780079039897...AlgebraISBN:9780079039897Author:CarterPublisher:McGraw Hill
 Functions and Change: A Modeling Approach to Coll...AlgebraISBN:9781337111348Author:Bruce Crauder, Benny Evans, Alan NoellPublisher:Cengage Learning
 Mathematics For Machine TechnologyAdvanced MathISBN:9781337798310Author:Peterson, John.Publisher:Cengage Learning,
 Elementary Geometry for College StudentsGeometryISBN:9781285195698Author:Daniel C. Alexander, Geralyn M. KoeberleinPublisher:Cengage Learning
Holt Mcdougal Larson Pre-algebra: Student Edition...
Algebra
ISBN:9780547587776
Author:HOLT MCDOUGAL
Publisher:HOLT MCDOUGAL
Big Ideas Math A Bridge To Success Algebra 1: Stu...
Algebra
ISBN:9781680331141
Author:HOUGHTON MIFFLIN HARCOURT
Publisher:Houghton Mifflin Harcourt
Glencoe Algebra 1, Student Edition, 9780079039897...
Algebra
ISBN:9780079039897
Author:Carter
Publisher:McGraw Hill
Functions and Change: A Modeling Approach to Coll...
Algebra
ISBN:9781337111348
Author:Bruce Crauder, Benny Evans, Alan Noell
Publisher:Cengage Learning
Mathematics For Machine Technology
Advanced Math
ISBN:9781337798310
Author:Peterson, John.
Publisher:Cengage Learning,
Elementary Geometry for College Students
Geometry
ISBN:9781285195698
Author:Daniel C. Alexander, Geralyn M. Koeberlein
Publisher:Cengage Learning
What Are Research Ethics?; Author: HighSchoolScience101;https://www.youtube.com/watch?v=nX4c3V23DZI;License: Standard YouTube License, CC-BY
What is Ethics in Research - ethics in research (research ethics); Author: Chee-Onn Leong;https://www.youtube.com/watch?v=W8Vk0sXtMGU;License: Standard YouTube License, CC-BY