
Introductory Statistics Plus Mylab Statistics With Pearson Etext -- Access Card Package (3rd Edition)
3rd Edition
ISBN: 9780135229996
Author: Robert Gould, Rebecca Wong, Colleen N. Ryan
Publisher: PEARSON
expand_more
expand_more
format_list_bulleted
Concept explainers
Videos
Textbook Question
Chapter 1, Problem 5SE
The data in Table 1A were collected from one of the authors’ statistics classes. The first row gives the variable, and each of the other rows represents a student in the class.
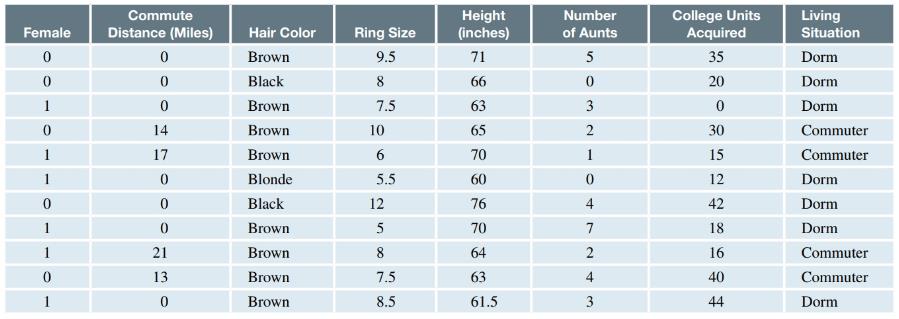
TABLE 1A
Give an example of another numerical variable we might have recorded for the students whose data are in Table 1A?
Expert Solution & Answer

Learn your wayIncludes step-by-step video

schedule02:31
Students have asked these similar questions
The following ordered data list shows the data speeds for cell phones used by a
telephone company at an airport:
A. Calculate the Measures of Central Tendency from the ungrouped data list.
B. Group the data in an appropriate frequency table.
C. Calculate the Measures of Central Tendency using the table in point B.
0.8
1.4
1.8
1.9
3.2
3.6
4.5
4.5
4.6
6.2
6.5
7.7
7.9
9.9
10.2
10.3
10.9
11.1
11.1
11.6
11.8
12.0
13.1
13.5
13.7
14.1
14.2
14.7
15.0
15.1
15.5
15.8
16.0
17.5
18.2
20.2
21.1
21.5
22.2
22.4
23.1
24.5
25.7
28.5
34.6
38.5
43.0
55.6
71.3
77.8
II Consider the following data matrix X:
X1
X2
0.5
0.4
0.2 0.5
0.5
0.5
10.3 10
10.1 10.4
10.1
10.5
What will the resulting clusters be when using the k-Means method with k = 2. In your own words, explain why this result is
indeed expected, i.e. why this clustering minimises the ESS map.
why the answer is 3 and 10?
Chapter 1 Solutions
Introductory Statistics Plus Mylab Statistics With Pearson Etext -- Access Card Package (3rd Edition)
Ch. 1 - The data in Table 1A were collected from one of...Ch. 1 - The data in Table 1A were collected from one of...Ch. 1 - The data in Table 1A were collected from one of...Ch. 1 - The data in Table 1A were collected from one of...Ch. 1 - The data in Table 1A were collected from one of...Ch. 1 - The data in Table 1A were collected from one of...Ch. 1 - The data in Table 1A were collected from one of...Ch. 1 - Coding Suppose you decided to code living...Ch. 1 - The data in Table 1A were collected from one of...Ch. 1 - Coding Students who have accumulated fewer than 30...
Ch. 1 - Facebook Wall Posts (Example 2) A student shared...Ch. 1 - Age of Marriage A student did a survey on the age...Ch. 1 - Snacks Emmanuel, a student at a Los Angeles high...Ch. 1 - Movies A sample of students were questioned to...Ch. 1 - Use the data in Table 1A to answer questions 1.15...Ch. 1 - Use the data in Table 1A to answer questions 1.15...Ch. 1 - Use the data in Table 1A to answer questions 1.15...Ch. 1 - Use the data in Table 1A to answer questions 1.15...Ch. 1 - Investigating Data (Example 4) A data set on Shark...Ch. 1 - Investigating Data Suppose a surfer wanted to...Ch. 1 - Hands (Example 5) A survey was done of men’s and...Ch. 1 - Hands-Biased A survey was done of men’s and...Ch. 1 - Finding and Using Percentages a. A statistics...Ch. 1 - Finding and Using Percentages a. A hospital...Ch. 1 - Women Find the frequency, proportion, and...Ch. 1 - Brown-Haired People Find the frequency,...Ch. 1 - Two-Way Table from Data Make a two-way table from...Ch. 1 - Two-Way Table from Data Make a two-way table from...Ch. 1 - Occupation Growth (Example 6) The 2017 World...Ch. 1 - Chocolate Sales The 2017 World Almanac and Book of...Ch. 1 - Incarceration Rates (Example 7) The table gives...Ch. 1 - Population Density The accompanying table gives...Ch. 1 - Health Insurance The accompanying table gives the...Ch. 1 - Cable TV Subscriptions The accompanying table...Ch. 1 - Percentage of Elderly The projected U.S....Ch. 1 - Marriage and Divorce The marriage and divorce...Ch. 1 - Course Enrollment Rates Two sections of statistics...Ch. 1 - Prob. 38SECh. 1 - For Exercises 1.39 through 1.44, indicate whether...Ch. 1 - For Exercises 1.39 through 1.44, indicate whether...Ch. 1 - For Exercises 1.39 through 1.44, indicate whether...Ch. 1 - For Exercises 1.39 through 1.44, indicate whether...Ch. 1 - For Exercises 1.39 through 1.44, indicate whether...Ch. 1 - For Exercises 1.39 through 1.44, indicate whether...Ch. 1 - Vitamin C and Cancer The blog NHS Choices...Ch. 1 - Aloe Vera You can find many testimonials on the...Ch. 1 - Effects of Tutoring on Math Grades (Example 8) A...Ch. 1 - Treating Depression A doctor who believes strongly...Ch. 1 - Try Exercise and Language Learning (Example 9) In...Ch. 1 - Pneumonia Vaccine for Young Children A study...Ch. 1 - Does Fish Oil Lower Asthma Risk? The New England...Ch. 1 - Association between Glycemic Load and Acne? An...Ch. 1 - Milk and Cartilage (Example 10) Cartilage is a...Ch. 1 - Autism and MMR Vaccine An article by Wakefield et...Ch. 1 - Prob. 55SECh. 1 - Effect of Confederates on Compliance A study was...Ch. 1 - A Salad a Day Keeps Stroke Away? The Harvard Heart...Ch. 1 - Does Drinking Sugary Beverages Lead to Dementia?...Ch. 1 - Secondhand Smoke Exposure and Young Children...Ch. 1 - Prob. 60CRECh. 1 - Speeding Tickets College students who were drivers...Ch. 1 - Prob. 62CRECh. 1 - Writing: Vitamin D Describe the design of a...Ch. 1 - Writing: Strokes People who have had strokes are...Ch. 1 - Yoga and High-Risk Adolescents Can mindful yoga...Ch. 1 - Neurofeedback and ADHD Some studies have indicated...Ch. 1 - Virtual Reality and Fall Risk A study was...Ch. 1 - Ear Infections Babies 6 to 23 months of age with...Ch. 1 - Effects of Light Exposure A study carried out by...Ch. 1 - Scared Straight The idea of sending delinquents to...
Additional Math Textbook Solutions
Find more solutions based on key concepts
TRY IT YOURSELF 1
Find the mean of the points scored by the 51 winning teams listed on page 39.
Elementary Statistics: Picturing the World (7th Edition)
CHECK POINT 1 In a survey on musical tastes, respondents were asked: Do you listed to classical music? Do you l...
Thinking Mathematically (6th Edition)
In Exercise 1–6, find the domain and range of each function.
5.
University Calculus: Early Transcendentals (4th Edition)
Fill in each blanks so that the resulting statement is true. Any set of ordered pairs is called a/an _______. T...
College Algebra (7th Edition)
Whether the requirements for a hypothesis test are satisfied or not.
Elementary Statistics
Calculate following proportion 637=y100
Pre-Algebra Student Edition
Knowledge Booster


Learn more about
Need a deep-dive on the concept behind this application? Look no further. Learn more about this topic, statistics and related others by exploring similar questions and additional content below.Similar questions
- PS 9 Two films are shown on screen A and screen B at a cinema each evening. The numbers of people viewing the films on 12 consecutive evenings are shown in the back-to-back stem-and-leaf diagram. Screen A (12) Screen B (12) 8 037 34 7 6 4 0 534 74 1645678 92 71689 Key: 116|4 represents 61 viewers for A and 64 viewers for B A second stem-and-leaf diagram (with rows of the same width as the previous diagram) is drawn showing the total number of people viewing films at the cinema on each of these 12 evenings. Find the least and greatest possible number of rows that this second diagram could have. TIP On the evening when 30 people viewed films on screen A, there could have been as few as 37 or as many as 79 people viewing films on screen B.arrow_forwardQ.2.4 There are twelve (12) teams participating in a pub quiz. What is the probability of correctly predicting the top three teams at the end of the competition, in the correct order? Give your final answer as a fraction in its simplest form.arrow_forwardThe table below indicates the number of years of experience of a sample of employees who work on a particular production line and the corresponding number of units of a good that each employee produced last month. Years of Experience (x) Number of Goods (y) 11 63 5 57 1 48 4 54 5 45 3 51 Q.1.1 By completing the table below and then applying the relevant formulae, determine the line of best fit for this bivariate data set. Do NOT change the units for the variables. X y X2 xy Ex= Ey= EX2 EXY= Q.1.2 Estimate the number of units of the good that would have been produced last month by an employee with 8 years of experience. Q.1.3 Using your calculator, determine the coefficient of correlation for the data set. Interpret your answer. Q.1.4 Compute the coefficient of determination for the data set. Interpret your answer.arrow_forward
- Can you answer this question for mearrow_forwardTechniques QUAT6221 2025 PT B... TM Tabudi Maphoru Activities Assessments Class Progress lIE Library • Help v The table below shows the prices (R) and quantities (kg) of rice, meat and potatoes items bought during 2013 and 2014: 2013 2014 P1Qo PoQo Q1Po P1Q1 Price Ро Quantity Qo Price P1 Quantity Q1 Rice 7 80 6 70 480 560 490 420 Meat 30 50 35 60 1 750 1 500 1 800 2 100 Potatoes 3 100 3 100 300 300 300 300 TOTAL 40 230 44 230 2 530 2 360 2 590 2 820 Instructions: 1 Corall dawn to tha bottom of thir ceraan urina se se tha haca nariad in archerca antarand cubmit Q Search ENG US 口X 2025/05arrow_forwardThe table below indicates the number of years of experience of a sample of employees who work on a particular production line and the corresponding number of units of a good that each employee produced last month. Years of Experience (x) Number of Goods (y) 11 63 5 57 1 48 4 54 45 3 51 Q.1.1 By completing the table below and then applying the relevant formulae, determine the line of best fit for this bivariate data set. Do NOT change the units for the variables. X y X2 xy Ex= Ey= EX2 EXY= Q.1.2 Estimate the number of units of the good that would have been produced last month by an employee with 8 years of experience. Q.1.3 Using your calculator, determine the coefficient of correlation for the data set. Interpret your answer. Q.1.4 Compute the coefficient of determination for the data set. Interpret your answer.arrow_forward
- Q.3.2 A sample of consumers was asked to name their favourite fruit. The results regarding the popularity of the different fruits are given in the following table. Type of Fruit Number of Consumers Banana 25 Apple 20 Orange 5 TOTAL 50 Draw a bar chart to graphically illustrate the results given in the table.arrow_forwardQ.2.3 The probability that a randomly selected employee of Company Z is female is 0.75. The probability that an employee of the same company works in the Production department, given that the employee is female, is 0.25. What is the probability that a randomly selected employee of the company will be female and will work in the Production department? Q.2.4 There are twelve (12) teams participating in a pub quiz. What is the probability of correctly predicting the top three teams at the end of the competition, in the correct order? Give your final answer as a fraction in its simplest form.arrow_forwardQ.2.1 A bag contains 13 red and 9 green marbles. You are asked to select two (2) marbles from the bag. The first marble selected will not be placed back into the bag. Q.2.1.1 Construct a probability tree to indicate the various possible outcomes and their probabilities (as fractions). Q.2.1.2 What is the probability that the two selected marbles will be the same colour? Q.2.2 The following contingency table gives the results of a sample survey of South African male and female respondents with regard to their preferred brand of sports watch: PREFERRED BRAND OF SPORTS WATCH Samsung Apple Garmin TOTAL No. of Females 30 100 40 170 No. of Males 75 125 80 280 TOTAL 105 225 120 450 Q.2.2.1 What is the probability of randomly selecting a respondent from the sample who prefers Garmin? Q.2.2.2 What is the probability of randomly selecting a respondent from the sample who is not female? Q.2.2.3 What is the probability of randomly…arrow_forward
- Test the claim that a student's pulse rate is different when taking a quiz than attending a regular class. The mean pulse rate difference is 2.7 with 10 students. Use a significance level of 0.005. Pulse rate difference(Quiz - Lecture) 2 -1 5 -8 1 20 15 -4 9 -12arrow_forwardThe following ordered data list shows the data speeds for cell phones used by a telephone company at an airport: A. Calculate the Measures of Central Tendency from the ungrouped data list. B. Group the data in an appropriate frequency table. C. Calculate the Measures of Central Tendency using the table in point B. D. Are there differences in the measurements obtained in A and C? Why (give at least one justified reason)? I leave the answers to A and B to resolve the remaining two. 0.8 1.4 1.8 1.9 3.2 3.6 4.5 4.5 4.6 6.2 6.5 7.7 7.9 9.9 10.2 10.3 10.9 11.1 11.1 11.6 11.8 12.0 13.1 13.5 13.7 14.1 14.2 14.7 15.0 15.1 15.5 15.8 16.0 17.5 18.2 20.2 21.1 21.5 22.2 22.4 23.1 24.5 25.7 28.5 34.6 38.5 43.0 55.6 71.3 77.8 A. Measures of Central Tendency We are to calculate: Mean, Median, Mode The data (already ordered) is: 0.8, 1.4, 1.8, 1.9, 3.2, 3.6, 4.5, 4.5, 4.6, 6.2, 6.5, 7.7, 7.9, 9.9, 10.2, 10.3, 10.9, 11.1, 11.1, 11.6, 11.8, 12.0, 13.1, 13.5, 13.7, 14.1, 14.2, 14.7, 15.0, 15.1, 15.5,…arrow_forwardPEER REPLY 1: Choose a classmate's Main Post. 1. Indicate a range of values for the independent variable (x) that is reasonable based on the data provided. 2. Explain what the predicted range of dependent values should be based on the range of independent values.arrow_forward
arrow_back_ios
SEE MORE QUESTIONS
arrow_forward_ios
Recommended textbooks for you
 Holt Mcdougal Larson Pre-algebra: Student Edition...AlgebraISBN:9780547587776Author:HOLT MCDOUGALPublisher:HOLT MCDOUGAL
 Big Ideas Math A Bridge To Success Algebra 1: Stu...AlgebraISBN:9781680331141Author:HOUGHTON MIFFLIN HARCOURTPublisher:Houghton Mifflin Harcourt
 Glencoe Algebra 1, Student Edition, 9780079039897...AlgebraISBN:9780079039897Author:CarterPublisher:McGraw Hill
 Mathematics For Machine TechnologyAdvanced MathISBN:9781337798310Author:Peterson, John.Publisher:Cengage Learning,
 Functions and Change: A Modeling Approach to Coll...AlgebraISBN:9781337111348Author:Bruce Crauder, Benny Evans, Alan NoellPublisher:Cengage Learning
 College Algebra (MindTap Course List)AlgebraISBN:9781305652231Author:R. David Gustafson, Jeff HughesPublisher:Cengage Learning
Holt Mcdougal Larson Pre-algebra: Student Edition...
Algebra
ISBN:9780547587776
Author:HOLT MCDOUGAL
Publisher:HOLT MCDOUGAL
Big Ideas Math A Bridge To Success Algebra 1: Stu...
Algebra
ISBN:9781680331141
Author:HOUGHTON MIFFLIN HARCOURT
Publisher:Houghton Mifflin Harcourt
Glencoe Algebra 1, Student Edition, 9780079039897...
Algebra
ISBN:9780079039897
Author:Carter
Publisher:McGraw Hill
Mathematics For Machine Technology
Advanced Math
ISBN:9781337798310
Author:Peterson, John.
Publisher:Cengage Learning,
Functions and Change: A Modeling Approach to Coll...
Algebra
ISBN:9781337111348
Author:Bruce Crauder, Benny Evans, Alan Noell
Publisher:Cengage Learning
College Algebra (MindTap Course List)
Algebra
ISBN:9781305652231
Author:R. David Gustafson, Jeff Hughes
Publisher:Cengage Learning
Statistics 4.1 Introduction to Inferential Statistics; Author: Dr. Jack L. Jackson II;https://www.youtube.com/watch?v=QLo4TEvBvK4;License: Standard YouTube License, CC-BY