Intro Stats, Books a la Carte Edition (5th Edition)
5th Edition
ISBN: 9780134210285
Author: Richard D. De Veaux, Paul Velleman, David E. Bock
Publisher: PEARSON
bartleby

Concept explainers

bartleby

Videos

Textbook Question
Book Icon
Chapter 1, Problem 40E

(Exercises 27–40) For each description of data, identify the W’s, name the variables, specify for each variable whether its use indicates that it should be treated as categorical or quantitative, and, for any quantitative variable, identify the units in which it was measured (or note that they were not provided).

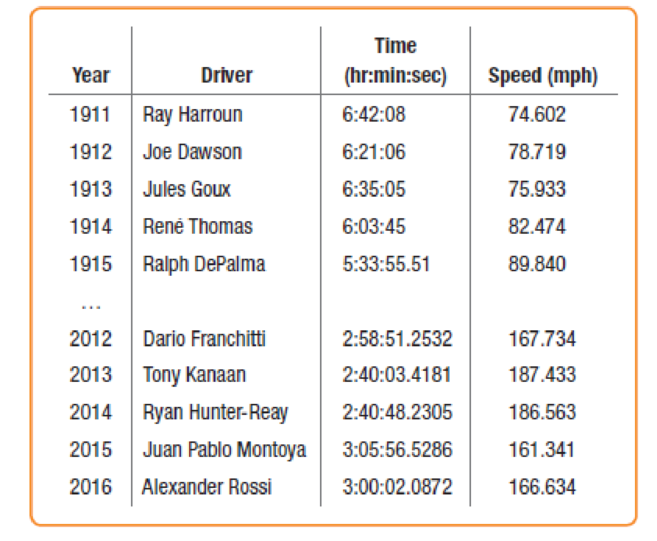
40. Indy 500 2016 The 2.5-mile Indianapolis Motor Speedway has been the home to a race on Memorial Day nearly every year since 1911. Even during the first race, there were controversies. Ralph Mulford was given the checkered flag first but took three extra laps just to make sure he’d completed 500 miles. When he finished, another driver, Ray Harroun, was being presented with the winner’s trophy, and Mulford’s protests were ignored. Harroun averaged 74.6 mph for the 500 miles. In 2013, the winner, Tony Kanaan, averaged over 187 mph, beating the previous record by over 17 mph!

Here are the data for the first five races and five recent Indianapolis 500 races.

Chapter 1, Problem 40E, (Exercises 2740) For each description of data, identify the Ws, name the variables, specify for each

Blurred answer
Students have asked these similar questions
A marketing agency wants to determine whether different advertising platforms generate significantly different levels of customer engagement. The agency measures the average number of daily clicks on ads for three platforms: Social Media, Search Engines, and Email Campaigns. The agency collects data on daily clicks for each platform over a 10-day period and wants to test whether there is a statistically significant difference in the mean number of daily clicks among these platforms. Conduct ANOVA test. You can provide your answer by inserting a text box and the answer must include: also please provide a step by on getting the answers in excel Null hypothesis, Alternative hypothesis, Show answer (output table/summary table), and Conclusion based on the P value.
A company found that the daily sales revenue of its flagship product follows a normal distribution with a mean of $4500 and a standard deviation of $450. The company defines a "high-sales day" that is, any day with sales exceeding $4800. please provide a step by step on how to get the answers Q: What percentage of days can the company expect to have "high-sales days" or sales greater than $4800? Q: What is the sales revenue threshold for the bottom 10% of days? (please note that 10% refers to the probability/area under bell curve towards the lower tail of bell curve) Provide answers in the yellow cells
Business Discuss

Chapter 1 Solutions

Intro Stats, Books a la Carte Edition (5th Edition)

Ch. 1 - Prob. 9ECh. 1 - ZIP codes The U.S. Postal Service uses five-digit...Ch. 1 - Voters A February 2010 Gallup Poll question asked,...Ch. 1 - Job hunting A June 2011 Gallup Poll asked...Ch. 1 - Medicine A pharmaceutical company conducts an...Ch. 1 - Stress A medical researcher measures the increase...Ch. 1 - Voting and elections Pollsters are interested in...Ch. 1 - Weather Meteorologists utilize sophisticated...Ch. 1 - (Exercises 1926) For each description of data,...Ch. 1 - (Exercises 1926) For each description of data,...Ch. 1 - (Exercises 1926) For each description of data,...Ch. 1 - (Exercises 1926) For each description of data,...Ch. 1 - (Exercises 1926) For each description of data,...Ch. 1 - (Exercises 1926) For each description of data,...Ch. 1 - (Exercises 1926) For each description of data,...Ch. 1 - (Exercises 1926) For each description of data,...Ch. 1 - (Exercises 2740) For each description of data,...Ch. 1 - (Exercises 2740) For each description of data,...Ch. 1 - (Exercises 2740) For each description of data,...Ch. 1 - (Exercises 2740) For each description of data,...Ch. 1 - (Exercises 2740) For each description of data,...Ch. 1 - (Exercises 2740) For each description of data,...Ch. 1 - (Exercises 2740) For each description of data,...Ch. 1 - (Exercises 2740) For each description of data,...Ch. 1 - (Exercises 2740) For each description of data,...Ch. 1 - (Exercises 2740) For each description of data,...Ch. 1 - (Exercises 2740) For each description of data,...Ch. 1 - (Exercises 2740) For each description of data,...Ch. 1 - (Exercises 2740) For each description of data,...Ch. 1 - (Exercises 2740) For each description of data,...Ch. 1 - Kentucky Derby 2016 on the computer Load the...Ch. 1 - Indy 500 2016 on the computer Load the Indy 500...
Knowledge Booster
Background pattern image
Statistics
Learn more about
Need a deep-dive on the concept behind this application? Look no further. Learn more about this topic, statistics and related others by exploring similar questions and additional content below.
Recommended textbooks for you
Text book image
Holt Mcdougal Larson Pre-algebra: Student Edition...
Algebra
ISBN:9780547587776
Author:HOLT MCDOUGAL
Publisher:HOLT MCDOUGAL
Text book image
Glencoe Algebra 1, Student Edition, 9780079039897...
Algebra
ISBN:9780079039897
Author:Carter
Publisher:McGraw Hill
Learn Algebra 6 : Rate of Change; Author: Derek Banas;https://www.youtube.com/watch?v=Dw701mKcJ1k;License: Standard YouTube License, CC-BY