
Sub part (a):
The possible combination of consumption of two goods.
Sub part (a):
Explanation of Solution
The consumption bundle of two goods can be calculated by using the following formula.
Substitute the respective values in equation (1) to calculate the number of peanut bags purchased while consuming 0 units of candy bars.
When the person consumes 0 quantities of candy bars, then he can purchase 10 units of peanut bags.
Table -1 shows the possible quantity of candy bars and peanut bags with the given level of income that is obtained by using equation (1).
Table -1
| Goods/Combination | 1 | 2 | 3 | 4 | 5 | 6 |
| Candy bars | 0 | 4 | 8 | 12 | 16 | 20 |
| Bags of peanuts | 10 | 8 | 6 | 4 | 2 | 0 |
Concept introduction:
Budget constraint: Budget constraints define the possible bundles of services and commodities that are purchased at a given price level with the entire income.
Sub part b:
The possible combination of consumption of two goods.
Sub part b:
Explanation of Solution
The diagram below shows the possible combination of two goods that can be purchased with the limited income. It is drawn based on the values given in the Table -1.
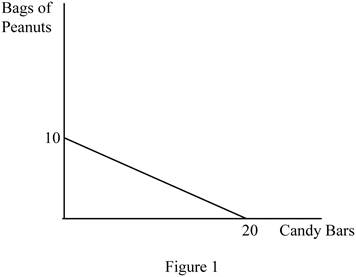
In Figure 1, the horizontal axis measures the quantity of candy bars and the vertical axis measures the quantity of peanut bags. The downward slope indicates the budget line.
The slope can be calculated as follows.
Thus, the slope of this budget line is -0.5.
Opportunity cost (OP) of obtaining one more candy bar can be calculated as follows.
In the calculation of opportunity cost, the sign can be ignored. Thus, the opportunity cost of getting one more candy bar is 0.5.
The opportunity cost (OP) of obtaining one more peanut bag can be calculated as follows.
In the calculation of opportunity cost, the sign can be ignored. The opportunity cost of getting one more candy bar is 2. The opportunity costs are constant over the possible combination of bundles since the slope of the budget line remains the same over different points in the budget line.
Concept introduction:
Budget constraint: Budget constraints define the possible bundles of services and commodities that are purchased at a given price level with the entire income.
Opportunity cost: Opportunity cost refers to the benefits given up in the process of obtaining some other benefit.
Sub part (c):
The possible combination of consumption of two goods.
Sub part (c):
Explanation of Solution
The budget line shows only the possible combination of goods and services that can be purchased simultaneously within the given income level. Thus, it does not determine the optimum quantity of two goods.
Concept introduction:
Budget constraint: Budget constraints define the possible bundles of services and commodities that are purchased at a given price level with the entire income.
Opportunity cost: Opportunity cost refers to the benefits given up in the process of obtaining some other benefit.
Sub part (d):
The possible combination of consumption of two goods.
Sub part (d):
Explanation of Solution
Table -2 shows the possible quantity of candy bars and peanut bags with the increased level of income that is obtained by using equation (1).
Table -2
| Goods/ Combination | 1 | 2 |
| Candy bars | 0 | 40 |
| Bags of peanuts | 20 | 0 |
The diagram below shows the possible combination of two goods that can be purchased with a limited income. It is drawn based on the values given in Table -2.
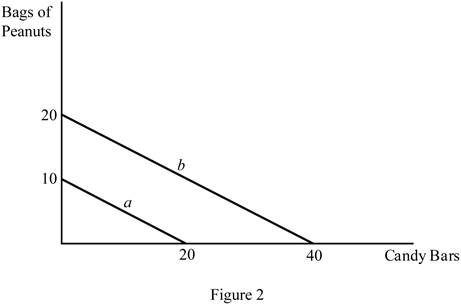
In Figure 2, the horizontal axis measures the quantity of the candy bar and the vertical axis measures the peanut bags. The downward slope (a) indicates the budget line with a $15 income, and the downward slope (b) indicates the budget line with a $30 income. Increasing the level of the income shifts the budget line to the right side.
Concept introduction:
Budget constraint: Budget constraints define the possible bundles of services and commodities that are purchased at a given price level with the entire income.
Opportunity cost: Opportunity cost refers to the benefits given up in the process of obtaining some other benefit.
Want to see more full solutions like this?
Chapter 1 Solutions
EP ECONOMICS,AP EDITION-CONNECT ACCESS

- G Interpret the following estimated regression equations: wagehr = 0.5+ 2.5exper, where wagehr is the wage, measured in £/hour and exper is years of experience, colGPA = 1.39.412 hsGPA where colGPA is grade point average for a college student, and hsGPA is the grade point average they achieved in high school, cons 124.84 +0.853 inc where cons and inc are annual household consumption and income, both measured in dollars What is (i) the predicted hourly wage for someone with five years of experience? (ii) the predicted grade point average in college for a student whose grade point average in high school was 4.0, (iii) the predicted consumption when household income is $30000? =arrow_forward1. Solving the system of inequalities: I≥3 x+y1 2. Graph y=-2(x+2)(x-3) 3. Please graph the following quadratic inequalities Solve y≤ -1²+2+3arrow_forwardNot use ai pleasearrow_forward
- not use ai pleasearrow_forwardWhat are the key factors that influence the decline of traditional retail businesses in the digital economy? 2. How does consumer behavior impact the success or failure of legacy retail brands? 3. What role does technological innovation play in sustaining long-term competitiveness for retailers? 4. How can traditional retailers effectively adapt their business models to meet evolving market demands?arrow_forwardProblem 1.1 Cyber security is a very costly dimension of doing business for many retailers and their customers who use credit and debit cards. A recent data breach of U.S.-based Home Depot involved some 56 million cardholders. Just to investigate and cover the immediate direct costs of this identity theft amounted to an estimated $62,000,000, of which $27,000,000 was recovered by insurance company payments. This does not include indirect costs, such as, lost future business, costs to banks, and cost to replace cards. If a cyber security vendor had proposed 8 years before the breach that a $10,000,000 investment in a malware detection system could guard the company's computer and payment systems from such a breach, would it have kept up with the rate of inflation estimated at 4% per year?arrow_forward
- Not use ai pleasearrow_forwardAnalyze financial banking products from the Asset-Based Financial Products side (like credit cards, loans, mortgages, etc.). Examine aspects such as liquidity, risk, and profitability from a company and an individual point of view. Ensure that the interventions demonstrate analytical skills and clearly express the points of view regarding the topic.arrow_forwardprovide source where information was retrieved NAME OF SCHOOL: Florida Polytechnical college ADDRESS: PRIVATE OR PUBLIC: ENTRY REQUIREMENTS - GPA, SAT/ ACT SCORES: IN STATE TUITION COST: DORMITORY COST: OFF CAMPUS HOUSING OPTIONS: AVERAGE MONTHLY RENT FOR A ROOM in the area: MEAL PLAN: Do they have them? Are they mandatory for freshmen? How much $: CAMPUS SIZE: (don't put acres - is it a small, medium, or large campus?) TEACHER STUDENT RATIO/CLASS SIZE: NUMBER OF UNDERGRADUATE (freshmen, soph, junior, seniors) STUDENTS ON CAMPUS: FINANCIAL AID/SCHOLARSHIPS OPPORTUNITIES: ACCEPTANCE RATE: GRADUATION RATE: ONLINE OPTION? BUSINESS DEGREES: (list them) ACADEMIC SUPPORT - TUTORING: JOB PLACEMENT/CAREER SERVICES: what % of students get lined up with jobs right out of college with the school's help? INTERNSHIP OPPORTUNITIES: Paid? Unpaid? STUDY ABROAD PROGRAMS: Do they exist? How much $? SPORTS: Competitive - D1, D2, D3, etc? Intramural? (non-competitive sports opportunities) CLUBS: How many?…arrow_forward
- Explain the following: How is 4 to 5 a 22% increase? How is 100 to 80 a 22% decrease? Not pictured: How is 100 to 90 a 11% decrease? How is 100 to 50 a 67% decrease?arrow_forwardWithout Trade Production Consumption With Trade Production Everglades Denali Shorts (Millions of Almonds Shorts Almonds pairs) (Millions of pounds) (Millions of pairs) (Millions of pounds) 12 16 5 30 12 16 5 30 64 0 0 20 Trade action Imports 13 ▼ Exports 39▾ Imports 13 ▼ Exports 39 Consumption Gains from Trade Increase in Consumptionarrow_forwardPractice: Their labor forces are each capable of supplying four million hours per week that can be used to produce shorts, almonds, or some combination of the two. Country Shorts Almonds (Pairs per hour of labor) (Pounds per hour of labor) Everglades 4 16 Denali 5 10 Suppose that initially Denali uses 1 million hours of labor per week to produce shorts and 3 million hours per week to produce almonds, while Everglades uses 3 million hours of labor per week to produce shorts and 1 million hours per week to produce almonds. As a result, Everglades produces 12 million pairs of shorts and 16 million pounds of almonds, and Denali produces 5 million pairs of shorts and 30 million pounds of almonds. Assume there are no other countries willing to engage in trade, so, in the absence of trade between these two countries, each country consumes the amount of shorts and almonds it produces. Everglades's opportunity cost of producing 1 pair of shorts is4 pounds of…arrow_forward


 Principles of Economics 2eEconomicsISBN:9781947172364Author:Steven A. Greenlaw; David ShapiroPublisher:OpenStax
 Principles of Economics (MindTap Course List)EconomicsISBN:9781305585126Author:N. Gregory MankiwPublisher:Cengage Learning
 Principles of Economics, 7th Edition (MindTap Cou...EconomicsISBN:9781285165875Author:N. Gregory MankiwPublisher:Cengage Learning