
Videos
CASE STUDY Chrysalises for Cash
The butterfly symbolizes the notion of personal change. Increasingly, people are turning to butterflies to consecrate meaningful
Due to the possibility of introducing an invasive species, butterfly suppliers are monitored by governmental agencies. Along with following regulations, butterfly suppliers must ensure quality and quantity of their product while maintaining a profit. To this end, an individual supplier may hire independent contractors to hatch the varieties needed. These entrepreneurs are paid a small fee for each chrysalis delivered, with a 50% bonus added for each hatched healthy butterfly. This fee structure provides little room for profit. Therefore, it is important that these contractors deliver a high proportion of healthy butterflies that emerge at a fairly predictable rate.
In Florida, one such entrepreneur specializes in harvesting the black swallowtail butterfly. In nature, the female butterfly seeks plants, such as carrot and parsley, to harvest and lay eggs on. A newly hatched caterpillar consumes the host plant, then secures itself and sheds its skin, revealing a chrysalis. During this resting phase, environmental factors such as temperature and humidity may affect the transformation process. Typically, the black swallowtail takes about 1 week to complete its metamorphosis and emerge from its chrysalis. The transformation occasionally results in deformities
The Florida contractor believes that there are differences in quality and emergence time among his broods. Not having taken a scientific approach to the problem, he relies on his memory of seasons past. It seems to him that late-season butterflies emerge sooner and with a greater number of deformities than their early-season counterparts. He also speculates that the type and nutritional value of the food consumed by the caterpillar might contribute to any observed differences. This year he is committed to a more formal approach to his butterfly harvest.
Since it takes 2 days to deliver the chrysalises from the contractor to the supplier, it is important that the butterflies do not emerge prematurely. It is equally important that the number of defective butterflies be minimized. With these two goals in mind, the contractor seeks the best combination of food source, fertilizer, and brood season to maximize his profits. To examine the effects of these variables on emergence time and number of deformed butterflies, the entrepreneur designed the following experiment.
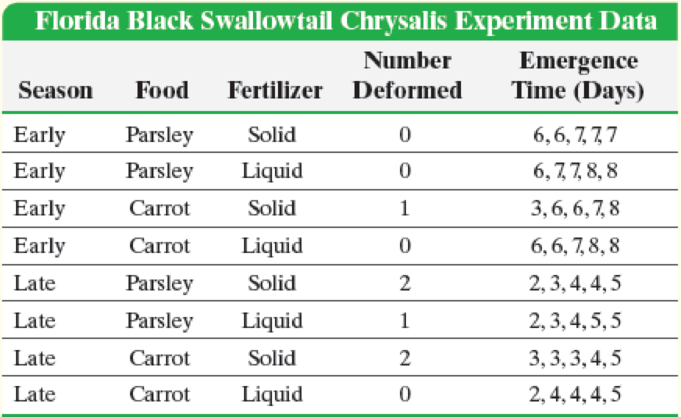
Eight identical pots were filled with equal amounts of a soil and watered carefully to ensure consistency. Two pots of carrot plants and two of parsley were set outside during the early part of the brood season. For the carrot pair, one pot was fed a fixed amount of liquid fertilizer, while the other was fed a nutritionally similar amount of solid fertilizer. The two pots of parsley were similarly fertilized. All four pots were placed next to each other to ensure similar exposures to environmental conditions such as temperature and solar radiation. Five black swallowtail caterpillars of similar age were placed into each container, each allowed to mature and form a chrysalis. The time from chrysalis formation until emergence was reported to the nearest day, along with any defects. The same procedure was followed with the four pots that were placed outdoors during the late brood season.
Write a report describing the experimental goals and design for the entrepreneur’s experiment. Follow the procedure outlined in the box on steps in designing and conducting an experiment (p. 44). Step 5(b), of this procedure is provided in the following table and should be included in your report.
In your report, provide a general descriptive analysis of these data. Be sure to include recommendations for the combination of season, food source, and type of fertilizer that result in the fewest deformed butterflies while achieving a long emergence time. Conclude your report with recommendations for further experiments. For each proposed experiment, be sure to do the following:
2. Define the factors that affect the response variables.
Want to see the full answer?
Check out a sample textbook solution
Chapter 1 Solutions
Fundamentals of Statistics (5th Edition)


- Business Discussarrow_forwardThe following data represent total ventilation measured in liters of air per minute per square meter of body area for two independent (and randomly chosen) samples. Analyze these data using the appropriate non-parametric hypothesis testarrow_forwardeach column represents before & after measurements on the same individual. Analyze with the appropriate non-parametric hypothesis test for a paired design.arrow_forward
- Should you be confident in applying your regression equation to estimate the heart rate of a python at 35°C? Why or why not?arrow_forwardGiven your fitted regression line, what would be the residual for snake #5 (10 C)?arrow_forwardCalculate the 95% confidence interval around your estimate of r using Fisher’s z-transformation. In your final answer, make sure to back-transform to the original units.arrow_forward

 Glencoe Algebra 1, Student Edition, 9780079039897...AlgebraISBN:9780079039897Author:CarterPublisher:McGraw Hill
 Algebra: Structure And Method, Book 1AlgebraISBN:9780395977224Author:Richard G. Brown, Mary P. Dolciani, Robert H. Sorgenfrey, William L. ColePublisher:McDougal Littell
 Algebra & Trigonometry with Analytic GeometryAlgebraISBN:9781133382119Author:SwokowskiPublisher:Cengage
 Holt Mcdougal Larson Pre-algebra: Student Edition...AlgebraISBN:9780547587776Author:HOLT MCDOUGALPublisher:HOLT MCDOUGAL
 Trigonometry (MindTap Course List)TrigonometryISBN:9781337278461Author:Ron LarsonPublisher:Cengage Learning