Concept explainers
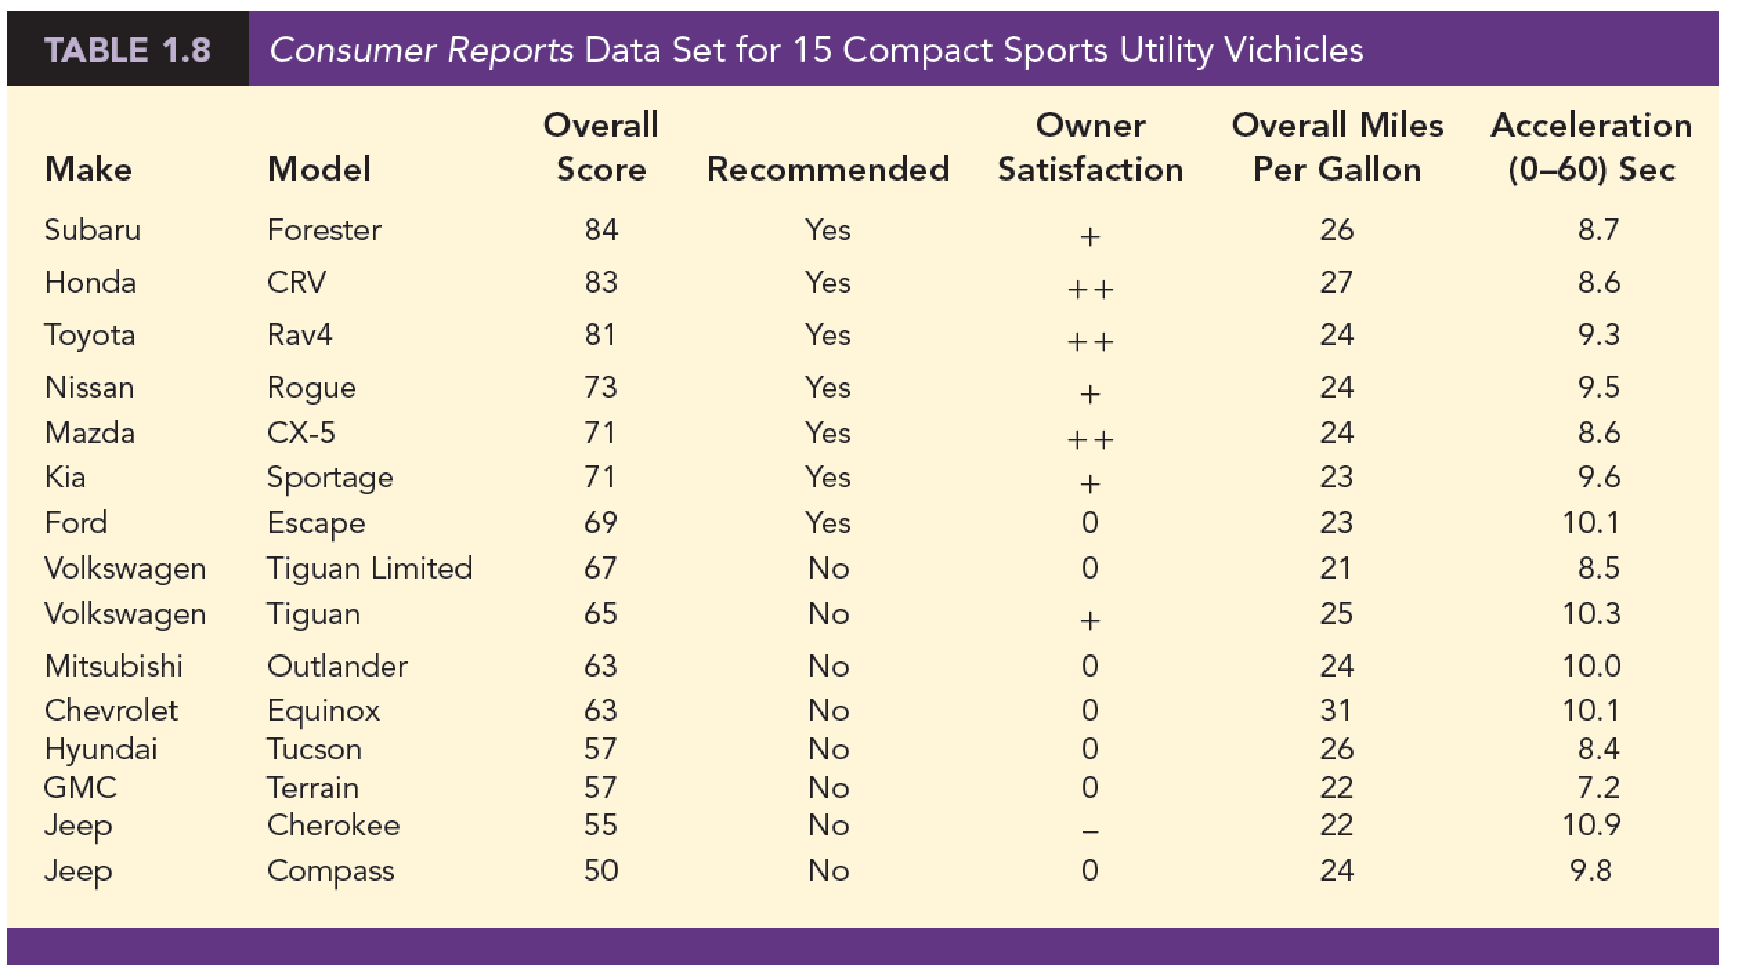
Comparing Compact SUVs. Consumer Reports evaluates products for consumers. The file CompactSUV contains the data shown in Table 1.8 for 15 compact sports utility vehicles (SUVs) from the 2018 model line (Consumer Reports website):
Make—manufacturer
Model—name of the model
Overall score—awarded based on a variety of measures, including those in this data set
Recommended—Consumer Reports recommends the vehicle or not
Owner satisfaction—satisfaction on a five-point scale based on the percentage of owners who would purchase the vehicle again (– –, –, 0, +, + +).
Overall miles per gallon—miles per gallon achieved in a 150-mile test trip
Acceleration (0–60 sec)—time in seconds it takes vehicle to reach 60 miles per hour from a standstill with the engine idling
- a. How many variables are in the data set?
- b. Which of the variables are categorical, and which are quantitative?
- c. What percentage of these 15 vehicles are recommended?
- d. What is the average of the overall miles per gallon across all 15 vehicles?
- e. For owner satisfaction, construct a bar chart similar to Figure 1.4.
- f. Show the frequency distribution for acceleration using the following intervals: 7.0–7.9, 8.0–8.9, 9.0–9.9, and 10.0–10.9. Construct a histogram similar to Figure 1.5.

a.
Find the number of variables in the data set.
Answer to Problem 25SE
There are five variables, which are overall score, recommended, owner satisfaction, overall miles per gallon, and acceleration (0–60) second.
Explanation of Solution
Table represent 15 compact sports utility vehicles from 2018 model lines.
Here, the variables are overall score, recommended, owner satisfaction, overall miles per gallon, and acceleration (0-60) second.
Thus, there are five variables.
b.
Identify the variables that are categorical and quantitative.
Answer to Problem 25SE
The variables recommended and owner satisfactions are categorical variables and overall scores, overall miles per gallon, and acceleration (0–60) second are Quantitative variables.
Explanation of Solution
Categorical data:
Categorical data are defined as the data that are names or labels assigned to identify an attribute or a category of an element under study. These are measured in the nominal or ordinal scale and may take numerical or non-numerical values. Arithmetic operations cannot be performed on the numerical values of the categorical data.
Quantitative data:
Quantitative data are defined as the data that count or measure a characteristic of an element under study. These are measured in the interval or ratio scale and take numerical values. Arithmetic operations can be performed on the numerical values of the quantitative data.
The variables recommended and owner satisfactions do not take numerical values. Therefore, the variables recommended and owner satisfactions are Categorical variables.
The variables overall scores, overall miles per gallon, and acceleration (0-60) second can take numerical values. Therefore, the variables overall scores, overall miles per gallon, and acceleration (0–60) second are Quantitative variables.
c.
Compute the percentages of the vehicles that are recommended.
Answer to Problem 25SE
About 47% of the vehicles are recommended.
Explanation of Solution
Calculation:
Among the 15 vehicles, 7 are recommended.
The percentage of vehicles that are recommended is as follows:
Thus, about 47% of the vehicles are recommended.
d.
Compute the average of the overall miles per gallon.
Answer to Problem 25SE
The average of the overall miles per gallon is 24.4 miles per gallon.
Explanation of Solution
Calculation:
The formula for average is as follows:
The required average is given by:
Thus, the average of the overall miles per gallon is 24.4 miles per gallon.
e.
Draw the bar chart for owner satisfaction.
Answer to Problem 25SE
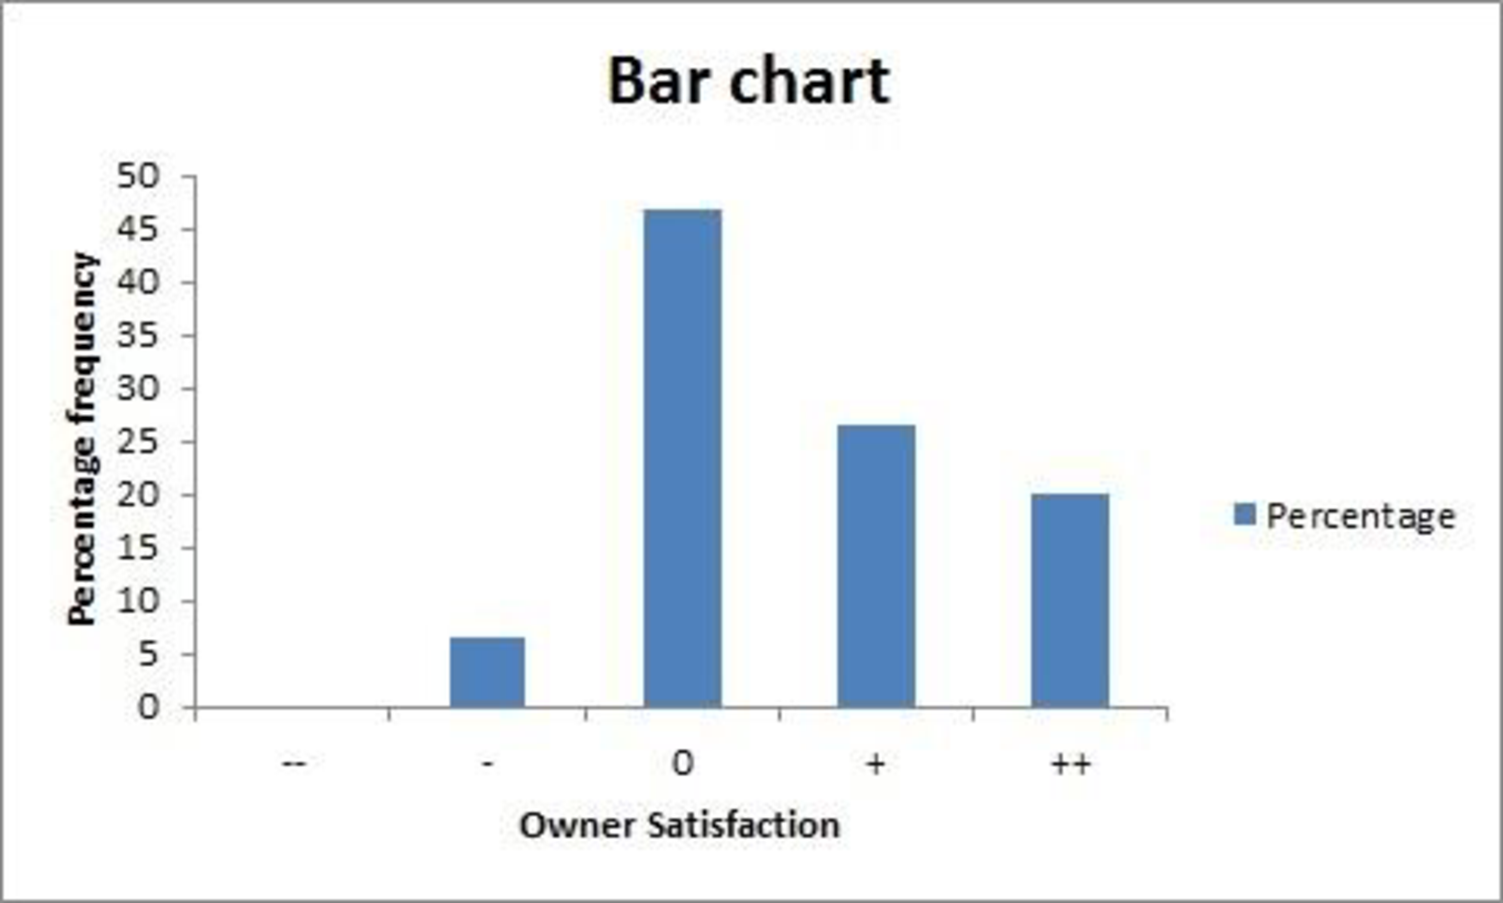
The bar chart for owner satisfaction is as follows:

Explanation of Solution
Calculation:
Among the 15 owner satisfaction, 7 are ‘0’.
The percentage for owner satisfaction ‘0’ is given as follows:
Thus, about 46.67% of the owner satisfaction is 0.
Similarly the other percentages are given in the following table:
| Owner Satisfaction | Percentage |
| - | |
| 0 | 46.67 |
| + | |
| ++ |
Bar chart:
Software procedure:
Step-by-step procedure to draw the bar chart using EXCEL:
- Open an EXCEL file and enter the given data.
- Select the cells containing the data of owner satisfaction, including the column name.
- Choose Insert > Column > 2-D.
Thus, the bar chart for owner satisfaction is obtained.
f.
Find the frequency distribution for the acceleration.
Draw the histogram for the acceleration.
Answer to Problem 25SE
The frequency distribution for the acceleration is as follows:
| Acceleration | Frequency |
| 7.0–7.9 | 1 |
| 8.0–8.9 | 5 |
| 9.0–9.9 | 4 |
| 10.0–10.9 | 5 |
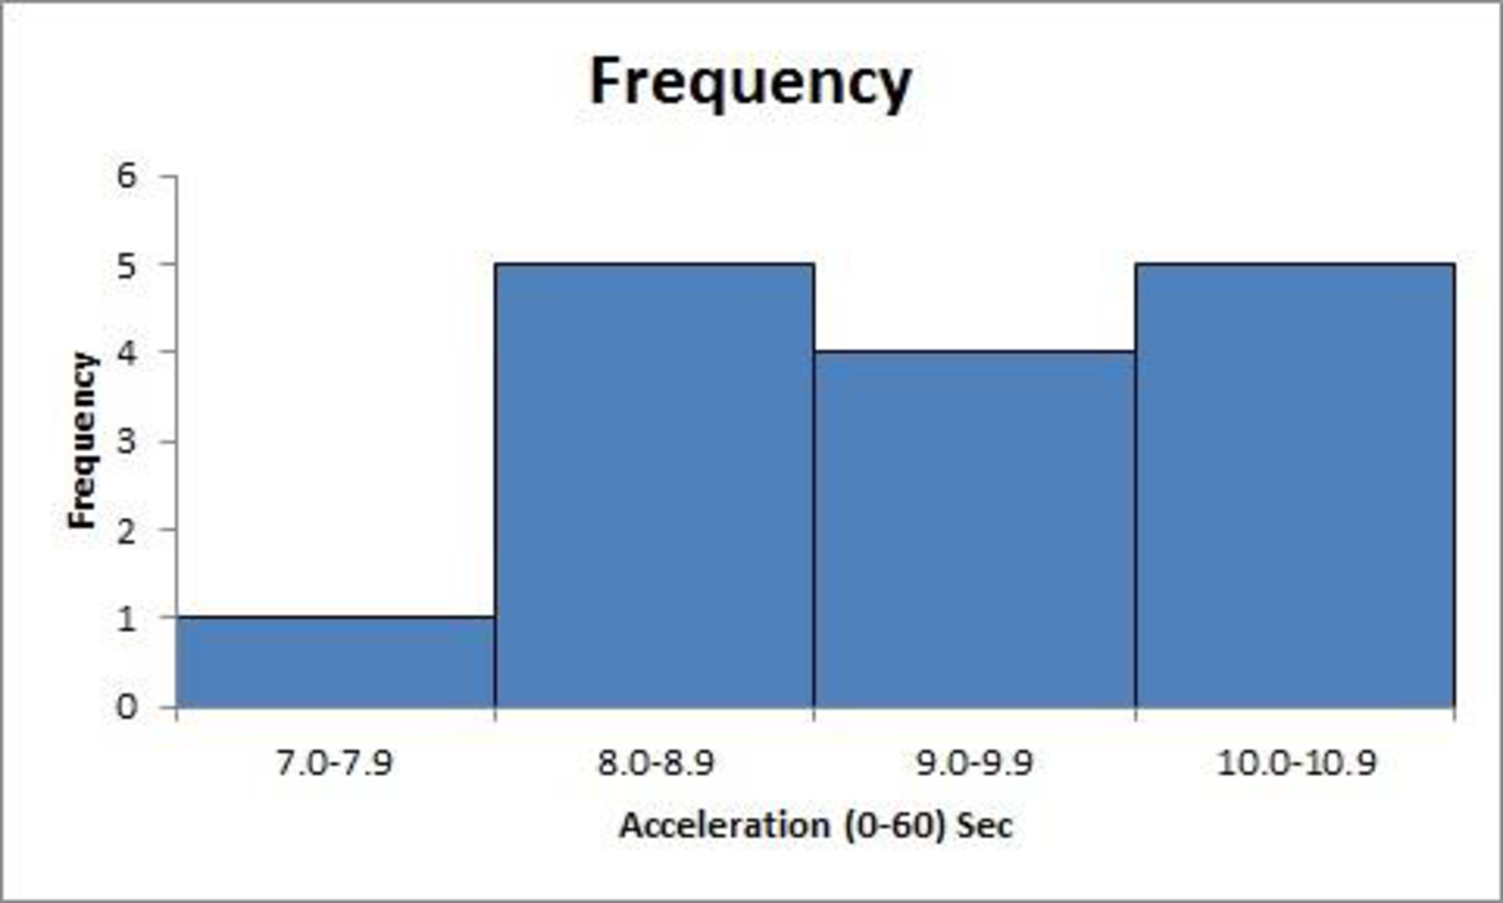
The histogram for acceleration is as follows:

Explanation of Solution
Calculation:
Frequency distribution:
Frequency of an interval is the number observations that fall in that interval. The frequency distribution is a table that displays the list of intervals and corresponding frequencies.
From the table it is clear that there is only one observation fall in the interval 7.0–7.9. Similarly the other frequencies are given in the following table:
| Acceleration | Frequency |
| 7.0–7.9 | 1 |
| 8.0–8.9 | 5 |
| 9.0–9.9 | 4 |
| 10.0–10.9 | 5 |
Histogram:
Software procedure:
Step-by-step procedure to draw the histogram using EXCEL is given below:
- Open an EXCEL file and enter the given data.
- Select the cells containing the data of acceleration and frequencies, including the column name.
- Choose Insert > Column > 2-D.
- Right click on the graph and select format Data series.
- Select gap width as 0%.
Thus, the histogram for acceleration is obtained.
Want to see more full solutions like this?
Chapter 1 Solutions
Essentials Of Statistics For Business & Economics
- A well-known company predominantly makes flat pack furniture for students. Variability with the automated machinery means the wood components are cut with a standard deviation in length of 0.45 mm. After they are cut the components are measured. If their length is more than 1.2 mm from the required length, the components are rejected. a) Calculate the percentage of components that get rejected. b) In a manufacturing run of 1000 units, how many are expected to be rejected? c) The company wishes to install more accurate equipment in order to reduce the rejection rate by one-half, using the same ±1.2mm rejection criterion. Calculate the maximum acceptable standard deviation of the new process.arrow_forward5. Let X and Y be independent random variables and let the superscripts denote symmetrization (recall Sect. 3.6). Show that (X + Y) X+ys.arrow_forward8. Suppose that the moments of the random variable X are constant, that is, suppose that EX" =c for all n ≥ 1, for some constant c. Find the distribution of X.arrow_forward
- 9. The concentration function of a random variable X is defined as Qx(h) = sup P(x ≤ X ≤x+h), h>0. Show that, if X and Y are independent random variables, then Qx+y (h) min{Qx(h). Qr (h)).arrow_forward10. Prove that, if (t)=1+0(12) as asf->> O is a characteristic function, then p = 1.arrow_forward9. The concentration function of a random variable X is defined as Qx(h) sup P(x ≤x≤x+h), h>0. (b) Is it true that Qx(ah) =aQx (h)?arrow_forward
- 3. Let X1, X2,..., X, be independent, Exp(1)-distributed random variables, and set V₁₁ = max Xk and W₁ = X₁+x+x+ Isk≤narrow_forward7. Consider the function (t)=(1+|t|)e, ER. (a) Prove that is a characteristic function. (b) Prove that the corresponding distribution is absolutely continuous. (c) Prove, departing from itself, that the distribution has finite mean and variance. (d) Prove, without computation, that the mean equals 0. (e) Compute the density.arrow_forward1. Show, by using characteristic, or moment generating functions, that if fx(x) = ½ex, -∞0 < x < ∞, then XY₁ - Y2, where Y₁ and Y2 are independent, exponentially distributed random variables.arrow_forward
- 1. Show, by using characteristic, or moment generating functions, that if 1 fx(x): x) = ½exarrow_forward1990) 02-02 50% mesob berceus +7 What's the probability of getting more than 1 head on 10 flips of a fair coin?arrow_forward9. The concentration function of a random variable X is defined as Qx(h) sup P(x≤x≤x+h), h>0. = x (a) Show that Qx+b(h) = Qx(h).arrow_forward
 Big Ideas Math A Bridge To Success Algebra 1: Stu...AlgebraISBN:9781680331141Author:HOUGHTON MIFFLIN HARCOURTPublisher:Houghton Mifflin Harcourt
 Glencoe Algebra 1, Student Edition, 9780079039897...AlgebraISBN:9780079039897Author:CarterPublisher:McGraw Hill
 Holt Mcdougal Larson Pre-algebra: Student Edition...AlgebraISBN:9780547587776Author:HOLT MCDOUGALPublisher:HOLT MCDOUGAL


