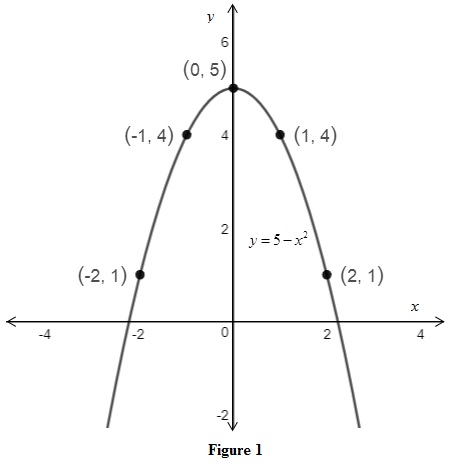
In Problems 1–3, use point-by-point plotting to sketch the graph of each equation.
1. y = 5 − x2
To sketch: The graph of the equation
Explanation of Solution
The given equation is
Choose integer values for x and find the corresponding ordered pairs of
The value of y for different x values for the equation
| x | |
| –2 | 1 |
| –1 | 4 |
| 0 | 5 |
| 1 | 4 |
| 2 | 1 |
Table 1
Use the above ordered pairs to sketch the graph of the equation

From Figure 1, it is observed that the graph of the equation
Want to see more full solutions like this?
Chapter 1 Solutions
Pearson eText for Calculus for Business, Economics, Life Sciences, and Social Sciences, Brief Version -- Instant Access (Pearson+)
- 3) Let G be the group generated by elements a and b satisfying the relations a² = 63, 66 = 1, and a ¹ba = b¹. Which of the following is equivalent to the element z = a a-2ba3b3? A) b-2a-1 B) ab² C) ab D) ba E) b²aarrow_forward1) Find all complex solutions to cos(z) =arrow_forward3) Compute where C is the circle |z― i| = - 1 2 2+1 Po z z - 2)2 dz traversed counterclockwise. Solution: TYPE YOUR SOLUTION HERE! INCLUDE A SKETCH OF THE COM- PLEX PLANE AND THE CURVE C. ALSO, MARK ALL SINGULARITIES OF THE INTEGRAND!arrow_forward
- 2) Consider the function f (z = re²) = e cos(In(r)) + ie¯* sin(ln(r)). Show that is holomorphic at all points except the origin. Also show that =arrow_forward3) If a is a positive number, what is the value of the following double integral? 2a Love Lv 2ay-y² .x2 + y2 dadyarrow_forward2) Consider the set SL(n, R) consisting of n x n matrices with real entries having de- terminant equal to 1. Prove that SL(n, R) is a group under the operation of matrix multiplication (it is referred to as the Special Linear Group).arrow_forward
- 1) What is the parity of the following permutation? (1389) (24) (567)arrow_forward4.7 Use forward and backward difference approximations of O(h) and a centered difference approximation of O(h²) to estimate the first derivative of the function examined in Prob. 4.5. Evaluate the derivative at x = 2 using a step size of h = 0.2. Compare your results with the true value of the derivative. Interpret your results on the basis of the remainder term of the Taylor series expansion.arrow_forward• Plane II is spanned by the vectors: P12 P2 = 1 • Subspace W is spanned by the vectors: W₁ = -- () · 2 1 W2 = 0arrow_forward
 Trigonometry (MindTap Course List)TrigonometryISBN:9781337278461Author:Ron LarsonPublisher:Cengage Learning
