
Elementary Statistics: Picturing The World 7th Edition Student Edition
7th Edition
ISBN: 9780134761428
Author: Betsy Farber Ron Larson
Publisher: Pearson Prentice Hall
expand_more
expand_more
format_list_bulleted
Concept explainers
Videos
Textbook Question
Chapter 1, Problem 1CT
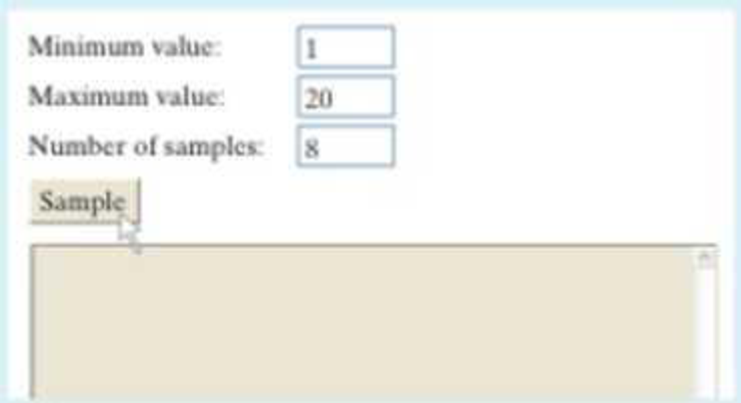
Specify the minimum, maximum, and number of samples to be 1, 20, and 8, respectively, as shown. Run the applet. Continue generating lists until you obtain one that shows that the random sample is taken with replacement. Write down this list. How do you know that the list is a random sample taken with replacement?
Expert Solution & Answer
Want to see the full answer?
Check out a sample textbook solution
Students have asked these similar questions
Techniques QUAT6221 2025 PT B...
TM
Tabudi Maphoru
Activities Assessments Class Progress lIE Library • Help v
The table below shows the prices (R) and quantities (kg) of rice, meat and potatoes items bought during 2013 and 2014:
2013
2014
P1Qo
PoQo
Q1Po P1Q1
Price
Ро
Quantity
Qo
Price
P1
Quantity
Q1
Rice
7
80
6
70
480
560
490
420
Meat
30
50
35
60
1 750
1 500
1 800
2 100
Potatoes
3
100
3
100
300
300
300
300
TOTAL
40
230
44
230
2 530
2 360
2 590
2 820
Instructions:
1 Corall dawn to tha bottom of thir ceraan urina se se tha haca nariad in archerca antarand cubmit
Q Search
ENG US
口X
2025/05
The table below indicates the number of years of experience of a sample of employees who work on a particular production line and the corresponding number of units of a good that each employee produced last month.
Years of Experience (x)
Number of Goods (y)
11
63
5
57
1
48
4
54
45
3
51
Q.1.1 By completing the table below and then applying the relevant formulae, determine the line of best fit for this bivariate data set.
Do NOT change the units for the variables.
X
y
X2
xy
Ex=
Ey=
EX2
EXY=
Q.1.2 Estimate the number of units of the good that would have been produced last month by an employee with 8 years of experience.
Q.1.3 Using your calculator, determine the coefficient of correlation for the data set.
Interpret your answer.
Q.1.4 Compute the coefficient of determination for the data set.
Interpret your answer.
Q.3.2 A sample of consumers was asked to name their favourite fruit. The results regarding the popularity of the different fruits are given in the following table.
Type of Fruit
Number of Consumers
Banana
25
Apple
20
Orange
5
TOTAL
50
Draw a bar chart to graphically illustrate the results given in the table.
Chapter 1 Solutions
Elementary Statistics: Picturing The World 7th Edition Student Edition
Ch. 1.1 - In a survey of 1501 ninth to twelfth graders in...Ch. 1.1 - Determine whether each number describes a...Ch. 1.1 - A study of 1000 U.S. adults found that when they...Ch. 1.1 - How is a sample related to a population?Ch. 1.1 - Why is a sample used more often than a population?Ch. 1.1 - What is the difference between a parameter and a...Ch. 1.1 - What are the two main branches of statistics?Ch. 1.1 - True or False? In Exercises 510, determine whether...Ch. 1.1 - True or False? In Exercises 510, determine whether...Ch. 1.1 - True or False? In Exercises 510, determine whether...
Ch. 1.1 - True or False? In Exercises 510, determine whether...Ch. 1.1 - True or False? In Exercises 510, determine whether...Ch. 1.1 - True or False? In Exercises 510, determine whether...Ch. 1.1 - Classifying a Data Set In Exercises 1120,...Ch. 1.1 - Classifying a Data Set In Exercises 1120,...Ch. 1.1 - Classifying a Data Set In Exercises 1120,...Ch. 1.1 - Classifying a Data Set In Exercises 1120,...Ch. 1.1 - Classifying a Data Set In Exercises 1120,...Ch. 1.1 - Classifying a Data Set In Exercises 1120,...Ch. 1.1 - Classifying a Data Set In Exercises 1120,...Ch. 1.1 - Classifying a Data Set In Exercises 1120,...Ch. 1.1 - Classifying a Data Set In Exercises 1120,...Ch. 1.1 - Classifying a Data Set In Exercises 1120,...Ch. 1.1 - Graphical Analysis In Exercises 2124, use the Venn...Ch. 1.1 - Graphical Analysis In Exercises 2124, use the Venn...Ch. 1.1 - Graphical Analysis In Exercises 2124, use the Venn...Ch. 1.1 - Graphical Analysis In Exercises 2124, use the Venn...Ch. 1.1 - Identifying Data Sets In Exercises 2534, identify...Ch. 1.1 - Identifying Data Sets In Exercises 2534, identify...Ch. 1.1 - Identifying Data Sets In Exercises 2534, identify...Ch. 1.1 - Identifying Data Sets In Exercises 2534, identify...Ch. 1.1 - Identifying Data Sets In Exercises 2534, identify...Ch. 1.1 - Identifying Data Sets In Exercises 2534, identify...Ch. 1.1 - Identifying Data Sets In Exercises 2534, identify...Ch. 1.1 - Identifying Data Sets In Exercises 2534, identify...Ch. 1.1 - Identifying Data Sets In Exercises 2534, identify...Ch. 1.1 - Identifying Data Sets In Exercises 2534, identify...Ch. 1.1 - Distinguishing Between a Parameter and a Statistic...Ch. 1.1 - Distinguishing Between a Parameter and a Statistic...Ch. 1.1 - Distinguishing Between a Parameter and a Statistic...Ch. 1.1 - Distinguishing Between a Parameter and a Statistic...Ch. 1.1 - Distinguishing Between a Parameter and a Statistic...Ch. 1.1 - Distinguishing Between a Parameter and a Statistic...Ch. 1.1 - Distinguishing Between a Parameter and a Statistic...Ch. 1.1 - Distinguishing Between a Parameter and a Statistic...Ch. 1.1 - Descriptive and Inferential Statistics Which part...Ch. 1.1 - Descriptive and Inferential Statistics Which part...Ch. 1.1 - Exercise and Cognitive Ability A study of 876...Ch. 1.1 - Increase in Obesity Rates A study shows that the...Ch. 1.1 - Sleep and Student Achievement A study shows the...Ch. 1.2 - The populations of several U.S. cities are shown...Ch. 1.2 - For each data set. determine whether the data are...Ch. 1.2 - For each data set, determine whether the data are...Ch. 1.2 - Name each level of measurement for which data can...Ch. 1.2 - Name each level of measurement for which data can...Ch. 1.2 - True or False? In Exercises 36, determine whether...Ch. 1.2 - True or False? In Exercises 36, determine whether...Ch. 1.2 - True or False? In Exercises 36, determine whether...Ch. 1.2 - True or False? In Exercises 36, determine whether...Ch. 1.2 - Classifying Data by Type In Exercises 714,...Ch. 1.2 - Classifying Data by Type In Exercises 714,...Ch. 1.2 - Classifying Data by Type In Exercises 714,...Ch. 1.2 - Classifying Data by Type In Exercises 714,...Ch. 1.2 - Classifying Data by Type In Exercises 714,...Ch. 1.2 - Classifying Data by Type In Exercises 714,...Ch. 1.2 - Classifying Data by Type In Exercises 714,...Ch. 1.2 - Classifying Data by Type In Exercises 714,...Ch. 1.2 - Classifying Data By Level In Exercises 1520,...Ch. 1.2 - Classifying Data By Level In Exercises 1520,...Ch. 1.2 - Classifying Data By Level In Exercises 1520,...Ch. 1.2 - Classifying Data By Level In Exercises 1520,...Ch. 1.2 - Classifying Data By Level In Exercises 1520,...Ch. 1.2 - Classifying Data By Level In Exercises 1520,...Ch. 1.2 - Graphical Analysis In Exercises 2124, determine...Ch. 1.2 - Graphical Analysis In Exercises 2124, determine...Ch. 1.2 - Graphical Analysis In Exercises 2124, determine...Ch. 1.2 - Graphical Analysis In Exercises 2124, determine...Ch. 1.2 - The items below appear on a physician's intake...Ch. 1.2 - Graphical Analysis In Exercises 2124, determine...Ch. 1.2 - Classifying Data by Type and Level In Exercises...Ch. 1.2 - Classifying Data by Type and Level In Exercises...Ch. 1.2 - Classifying Data by Type and Level In Exercises...Ch. 1.2 - Classifying Data by Type and Level In Exercises...Ch. 1.2 - Classifying Data by Type and Level In Exercises...Ch. 1.2 - Classifying Data by Type and Level In Exercises...Ch. 1.2 - Extending Concepts 33. Writing What is an inherent...Ch. 1.2 - Describe two examples of data sets for each of the...Ch. 1.2 - For more than 50 years. The Harris Poll has...Ch. 1.2 - Reputations of 10 Companies in the U.S. (Source:...Ch. 1.2 - Reputations of 10 Companies in the U.S. (Source:...Ch. 1.2 - Reputations of 10 Companies in the U.S. (Source:...Ch. 1.2 - Reputations of 10 Companies in the U.S. (Source:...Ch. 1.2 - For more than 50 years. The Harris Poll has...Ch. 1.3 - The Pennsylvania Game Commission conducted a study...Ch. 1.3 - Prob. 2TYCh. 1.3 - A company employs 79 people. Choose a simple...Ch. 1.3 - You want to determine the opinions of students...Ch. 1.3 - What is the difference between an observational...Ch. 1.3 - What is the difference between a census and a...Ch. 1.3 - What is the difference between a random sample and...Ch. 1.3 - What is replication in an experiment? Why is...Ch. 1.3 - True or False? In Exercises 510, determine whether...Ch. 1.3 - True or False? In Exercises 510, determine whether...Ch. 1.3 - True or False? In Exercises 510, determine whether...Ch. 1.3 - True or False? In Exercises 510, determine whether...Ch. 1.3 - True or False? In Exercises 510, determine whether...Ch. 1.3 - True or False? In Exercises 510, determine whether...Ch. 1.3 - Distinguishing Between an Observational Study and...Ch. 1.3 - Distinguishing Between an Observational Study and...Ch. 1.3 - Distinguishing Between an Observational Study and...Ch. 1.3 - Distinguishing Between an Observational Study and...Ch. 1.3 - Random Number Table Use the sixth row of Table 1...Ch. 1.3 - Random Number Table Use the tenth row of Table 1...Ch. 1.3 - Random Numbers In Exercises 17 and 18, use...Ch. 1.3 - Random Numbers In Exercises 17 and 18, use...Ch. 1.3 - Allergy Drug A pharmaceutical company wants to...Ch. 1.3 - Dietary Supplement Researchers in Germany tested...Ch. 1.3 - Sleep Deprivation A researcher wants to study the...Ch. 1.3 - Using a Simple Random Sample Volunteers for an...Ch. 1.3 - Identifying Sampling Techniques In Exercises 2328,...Ch. 1.3 - Identifying Sampling Techniques In Exercises 2328,...Ch. 1.3 - Identifying Sampling Techniques In Exercises 2328,...Ch. 1.3 - Identifying Sampling Techniques In Exercises 2328,...Ch. 1.3 - Identifying Sampling Techniques In Exercises 2328,...Ch. 1.3 - Identifying Sampling Techniques In Exercises 2328,...Ch. 1.3 - Choosing Between a Census and a Sampling In...Ch. 1.3 - Choosing Between a Census and a Sampling In...Ch. 1.3 - Recognizing a Biased Question In Exercises 3134,...Ch. 1.3 - Recognizing a Biased Question In Exercises 3134,...Ch. 1.3 - Recognizing a Biased Question In Exercises 3134,...Ch. 1.3 - Recognizing a Biased Question In Exercises 3134,...Ch. 1.3 - Open and Closed Questions Two types of survey...Ch. 1.3 - Natural Experiments Observational studies are...Ch. 1.3 - Prob. 1ACh. 1.3 - In Exercises 14, identify the population and the...Ch. 1 - In Exercises 14, identify the population and the...Ch. 1 - In Exercises 14, identify the population and the...Ch. 1 - In Exercises 58, determine whether the number...Ch. 1 - In Exercises 58, determine whether the number...Ch. 1 - In Exercises 58, determine whether the number...Ch. 1 - In Exercises 58, determine whether the number...Ch. 1 - Which part of the survey described in Exercise 3...Ch. 1 - Which part of the survey described in Exercise 4...Ch. 1 - In Exercises 1114, determine whether the data are...Ch. 1 - In Exercises 1114, determine whether the data are...Ch. 1 - In Exercises 1114, determine whether the data are...Ch. 1 - In Exercises 1114, determine whether the data are...Ch. 1 - In Exercises 1518, determine the level of...Ch. 1 - In Exercises 1518, determine the level of...Ch. 1 - In Exercises 1518, determine the level of...Ch. 1 - In Exercises 1518, determine the level of...Ch. 1 - In Exercises 19 and 20, determine whether the...Ch. 1 - In Exercises 19 and 20, determine whether the...Ch. 1 - In Exercises 21 and 22, two hundred students...Ch. 1 - In Exercises 21 and 22, two hundred students...Ch. 1 - Identifying Sampling Techniques In Exercises 2328,...Ch. 1 - Identifying Sampling Techniques In Exercises 2328,...Ch. 1 - Identifying Sampling Techniques In Exercises 2328,...Ch. 1 - Identifying Sampling Techniques In Exercises 2328,...Ch. 1 - Identifying Sampling Techniques In Exercises 2328,...Ch. 1 - Identifying Sampling Techniques In Exercises 2328,...Ch. 1 - You want to know the favorite spring break...Ch. 1 - A study of the dietary habits of 359,264 Korean...Ch. 1 - Determine whether each number describes a...Ch. 1 - Determine whether the data are qualitative or...Ch. 1 - Determine the level of measurement of the data...Ch. 1 - Determine whether the study is an observational...Ch. 1 - An experiment is performed to test the effects of...Ch. 1 - Identify the sampling technique used in each...Ch. 1 - Which technique used in Exercise 7 could lead to a...Ch. 1 - Determine whether you would take a census or use a...Ch. 1 - Determine whether each number describes a...Ch. 1 - Specify the minimum, maximum, and number of...Ch. 1 - Use the applet to repeat Example 3 on page 21....Ch. 1 - Identify the sampling technique used, and discuss...Ch. 1 - Determine whether the data are qualitative or...Ch. 1 - Determine whether the survey question is biased....Ch. 1 - Researchers surveyed 19,183 U.S. physicians,...Ch. 1 - When do you think smartphone payments will replace...Ch. 1 - Data Classification (a) What type of data do you...Ch. 1 - How They Did It When The Harris Poll did a similar...Ch. 1 - The SEC (Securities and Exchange Commission) is...Ch. 1 - A quality control department is testing 25...Ch. 1 - Consider the population of ten digits: 0, 1, 2, 3,...Ch. 1 - Consider the population of 41 whole numbers from 0...Ch. 1 - Use random numbers to simulate rolling a six-sided...Ch. 1 - Prob. 6TCh. 1 - Use random numbers to simulate tossing a coin 100...Ch. 1 - You tossed a coin 100 times and got 77 heads and...Ch. 1 - A political analyst would like to survey a sample...
Knowledge Booster


Learn more about
Need a deep-dive on the concept behind this application? Look no further. Learn more about this topic, statistics and related others by exploring similar questions and additional content below.Similar questions
- Q.2.3 The probability that a randomly selected employee of Company Z is female is 0.75. The probability that an employee of the same company works in the Production department, given that the employee is female, is 0.25. What is the probability that a randomly selected employee of the company will be female and will work in the Production department? Q.2.4 There are twelve (12) teams participating in a pub quiz. What is the probability of correctly predicting the top three teams at the end of the competition, in the correct order? Give your final answer as a fraction in its simplest form.arrow_forwardQ.2.1 A bag contains 13 red and 9 green marbles. You are asked to select two (2) marbles from the bag. The first marble selected will not be placed back into the bag. Q.2.1.1 Construct a probability tree to indicate the various possible outcomes and their probabilities (as fractions). Q.2.1.2 What is the probability that the two selected marbles will be the same colour? Q.2.2 The following contingency table gives the results of a sample survey of South African male and female respondents with regard to their preferred brand of sports watch: PREFERRED BRAND OF SPORTS WATCH Samsung Apple Garmin TOTAL No. of Females 30 100 40 170 No. of Males 75 125 80 280 TOTAL 105 225 120 450 Q.2.2.1 What is the probability of randomly selecting a respondent from the sample who prefers Garmin? Q.2.2.2 What is the probability of randomly selecting a respondent from the sample who is not female? Q.2.2.3 What is the probability of randomly…arrow_forwardTest the claim that a student's pulse rate is different when taking a quiz than attending a regular class. The mean pulse rate difference is 2.7 with 10 students. Use a significance level of 0.005. Pulse rate difference(Quiz - Lecture) 2 -1 5 -8 1 20 15 -4 9 -12arrow_forward
- The following ordered data list shows the data speeds for cell phones used by a telephone company at an airport: A. Calculate the Measures of Central Tendency from the ungrouped data list. B. Group the data in an appropriate frequency table. C. Calculate the Measures of Central Tendency using the table in point B. D. Are there differences in the measurements obtained in A and C? Why (give at least one justified reason)? I leave the answers to A and B to resolve the remaining two. 0.8 1.4 1.8 1.9 3.2 3.6 4.5 4.5 4.6 6.2 6.5 7.7 7.9 9.9 10.2 10.3 10.9 11.1 11.1 11.6 11.8 12.0 13.1 13.5 13.7 14.1 14.2 14.7 15.0 15.1 15.5 15.8 16.0 17.5 18.2 20.2 21.1 21.5 22.2 22.4 23.1 24.5 25.7 28.5 34.6 38.5 43.0 55.6 71.3 77.8 A. Measures of Central Tendency We are to calculate: Mean, Median, Mode The data (already ordered) is: 0.8, 1.4, 1.8, 1.9, 3.2, 3.6, 4.5, 4.5, 4.6, 6.2, 6.5, 7.7, 7.9, 9.9, 10.2, 10.3, 10.9, 11.1, 11.1, 11.6, 11.8, 12.0, 13.1, 13.5, 13.7, 14.1, 14.2, 14.7, 15.0, 15.1, 15.5,…arrow_forwardPEER REPLY 1: Choose a classmate's Main Post. 1. Indicate a range of values for the independent variable (x) that is reasonable based on the data provided. 2. Explain what the predicted range of dependent values should be based on the range of independent values.arrow_forwardIn a company with 80 employees, 60 earn $10.00 per hour and 20 earn $13.00 per hour. Is this average hourly wage considered representative?arrow_forward
- The following is a list of questions answered correctly on an exam. Calculate the Measures of Central Tendency from the ungrouped data list. NUMBER OF QUESTIONS ANSWERED CORRECTLY ON AN APTITUDE EXAM 112 72 69 97 107 73 92 76 86 73 126 128 118 127 124 82 104 132 134 83 92 108 96 100 92 115 76 91 102 81 95 141 81 80 106 84 119 113 98 75 68 98 115 106 95 100 85 94 106 119arrow_forwardThe following ordered data list shows the data speeds for cell phones used by a telephone company at an airport: A. Calculate the Measures of Central Tendency using the table in point B. B. Are there differences in the measurements obtained in A and C? Why (give at least one justified reason)? 0.8 1.4 1.8 1.9 3.2 3.6 4.5 4.5 4.6 6.2 6.5 7.7 7.9 9.9 10.2 10.3 10.9 11.1 11.1 11.6 11.8 12.0 13.1 13.5 13.7 14.1 14.2 14.7 15.0 15.1 15.5 15.8 16.0 17.5 18.2 20.2 21.1 21.5 22.2 22.4 23.1 24.5 25.7 28.5 34.6 38.5 43.0 55.6 71.3 77.8arrow_forwardIn a company with 80 employees, 60 earn $10.00 per hour and 20 earn $13.00 per hour. a) Determine the average hourly wage. b) In part a), is the same answer obtained if the 60 employees have an average wage of $10.00 per hour? Prove your answer.arrow_forward
- The following ordered data list shows the data speeds for cell phones used by a telephone company at an airport: A. Calculate the Measures of Central Tendency from the ungrouped data list. B. Group the data in an appropriate frequency table. 0.8 1.4 1.8 1.9 3.2 3.6 4.5 4.5 4.6 6.2 6.5 7.7 7.9 9.9 10.2 10.3 10.9 11.1 11.1 11.6 11.8 12.0 13.1 13.5 13.7 14.1 14.2 14.7 15.0 15.1 15.5 15.8 16.0 17.5 18.2 20.2 21.1 21.5 22.2 22.4 23.1 24.5 25.7 28.5 34.6 38.5 43.0 55.6 71.3 77.8arrow_forwardBusinessarrow_forwardhttps://www.hawkeslearning.com/Statistics/dbs2/datasets.htmlarrow_forward
arrow_back_ios
SEE MORE QUESTIONS
arrow_forward_ios
Recommended textbooks for you
 Glencoe Algebra 1, Student Edition, 9780079039897...AlgebraISBN:9780079039897Author:CarterPublisher:McGraw Hill
 Holt Mcdougal Larson Pre-algebra: Student Edition...AlgebraISBN:9780547587776Author:HOLT MCDOUGALPublisher:HOLT MCDOUGAL
 Big Ideas Math A Bridge To Success Algebra 1: Stu...AlgebraISBN:9781680331141Author:HOUGHTON MIFFLIN HARCOURTPublisher:Houghton Mifflin Harcourt
 College Algebra (MindTap Course List)AlgebraISBN:9781305652231Author:R. David Gustafson, Jeff HughesPublisher:Cengage Learning
 Algebra: Structure And Method, Book 1AlgebraISBN:9780395977224Author:Richard G. Brown, Mary P. Dolciani, Robert H. Sorgenfrey, William L. ColePublisher:McDougal Littell
Glencoe Algebra 1, Student Edition, 9780079039897...
Algebra
ISBN:9780079039897
Author:Carter
Publisher:McGraw Hill
Holt Mcdougal Larson Pre-algebra: Student Edition...
Algebra
ISBN:9780547587776
Author:HOLT MCDOUGAL
Publisher:HOLT MCDOUGAL
Big Ideas Math A Bridge To Success Algebra 1: Stu...
Algebra
ISBN:9781680331141
Author:HOUGHTON MIFFLIN HARCOURT
Publisher:Houghton Mifflin Harcourt
College Algebra (MindTap Course List)
Algebra
ISBN:9781305652231
Author:R. David Gustafson, Jeff Hughes
Publisher:Cengage Learning
Algebra: Structure And Method, Book 1
Algebra
ISBN:9780395977224
Author:Richard G. Brown, Mary P. Dolciani, Robert H. Sorgenfrey, William L. Cole
Publisher:McDougal Littell
Statistics 4.1 Point Estimators; Author: Dr. Jack L. Jackson II;https://www.youtube.com/watch?v=2MrI0J8XCEE;License: Standard YouTube License, CC-BY
Statistics 101: Point Estimators; Author: Brandon Foltz;https://www.youtube.com/watch?v=4v41z3HwLaM;License: Standard YouTube License, CC-BY
Central limit theorem; Author: 365 Data Science;https://www.youtube.com/watch?v=b5xQmk9veZ4;License: Standard YouTube License, CC-BY
Point Estimate Definition & Example; Author: Prof. Essa;https://www.youtube.com/watch?v=OTVwtvQmSn0;License: Standard Youtube License
Point Estimation; Author: Vamsidhar Ambatipudi;https://www.youtube.com/watch?v=flqhlM2bZWc;License: Standard Youtube License