
Concept explainers
Videos
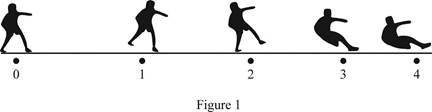
A softball player slides into second base. Use the particle model to draw a motion diagram of the player from the time he begins to slide until he reaches the base. Number the dots in order, starting with zero.
To draw: The motion diagram, using the particle model of a softball player.
Answer to Problem 1CQ
The motion diagram, using the particle model of a softball player from the time he begins to slide till he reaches the base is drawn.
Explanation of Solution
Given data:
A softball player slides into second base.
Explanation:
The velocity of softball player will be in the initial stage is zero and as he slides and moves slower and slower till he rest at the base and corresponding the travelling distance becomes smaller and smaller till he stops.
The motion diagram of the softball player from the time he begins to slide till he reaches the base is shown in Figure 1.
Conclusion:
Hence, the motion diagram, using the particle model of a softball player from the time he begins to slide till he reaches the base is drawn.
Want to see more full solutions like this?
Chapter 1 Solutions
College Physics: A Strategic Approach (4th Edition)
Additional Science Textbook Solutions
Applications and Investigations in Earth Science (9th Edition)
Human Physiology: An Integrated Approach (8th Edition)
Organic Chemistry (8th Edition)
Chemistry: An Introduction to General, Organic, and Biological Chemistry (13th Edition)
Introductory Chemistry (6th Edition)
Human Anatomy & Physiology (2nd Edition)


- Aromatic molecules like those in perfume have a diffusion coefficient in air of approximately 2×10⁻⁵m2/s2×10−5m2/s. Part A Estimate, to one significant figure, how many hours it takes perfume to diffuse 2.5 mm, about 6.5 ftft, in still air. Express your answer in hours to one significant figure.arrow_forwardRocket Science: CH 83. A rocket of mass M moving at speed v ejects an infinitesimal mass dm out its exhaust nozzle at speed vex. (a) Show that con- servation of momentum implies that M dy = vex dm, where dy is the change in the rocket's speed. (b) Integrate this equation from some initial speed v; and mass M; to a final speed vf and mass Mf Vf to show that the rocket's final velocity is given by the expression V₁ = V¡ + Vex ln(M¡/M₁).arrow_forwardFormant Freqmcy The horizontal dotted lines represent the formants. The first box represents the schwa sound. The second box is a different vowel. The scale is the same on each of these two vowels. Use the two formant contours to answer questions 12-16 SCHWA VOWEL 2 0.179362213 Time (s) 0.92125285 0.0299637119 4000 1079 Time(s) unknown 0.6843 13. Please describe what the tongue is doing to shift from the schwa to vowel 2? 14. Is vowel 2 a rounded or unrounded vowel? 15. Is vowel 2 a front or back vowel? 16. What vowel is vowel 2 (00, ee, ah) 0684285714arrow_forward
- microwavearrow_forward4) Consider the pulley (Mass = 20kg, Radius 0.3m) shown in the picture. Model this pulley as a uniform solid disk (1 = (1/2) MR2) that is hinged at its center of mass. If the hanging mass is 30 kg, and is released, (a) compute the angular acceleration of the pulley (b) calculate the acceleration of the hanging mass. A o 0.3 3019 20KSarrow_forwardRefer to the image attachedarrow_forward
- Shrinking Loop. A circular loop of flexible iron wire has an initial circumference of 161 cm , but its circumference is decreasing at a constant rate of 15.0 cm/s due to a tangential pull on the wire. The loop is in a constant uniform magnetic field of magnitude 1.00 T , which is oriented perpendicular to the plane of the loop. Assume that you are facing the loop and that the magnetic field points into the loop. Find the magnitude of the emf E induced in the loop after exactly time 9.00 s has passed since the circumference of the loop started to decrease. Find the direction of the induced current in the loop as viewed looking along the direction of the magnetic field. Please explain all stepsarrow_forwardMake up an application physics principle problem that provides three (3) significant equations based on the concepts of capacitors and ohm's law.arrow_forwardA straight horizontal garden hose 38.0 m long with an interior diameter of 1.50 cm is used to deliver 20oC water at the rate of 0.590 liters/s. Assuming that Poiseuille's Law applies, estimate the pressure drop (in Pa) from one end of the hose to the other.arrow_forward
- A rectangle measuring 30.0 cm by 40.0 cm is located inside a region of a spatially uniform magnetic field of 1.70 T , with the field perpendicular to the plane of the coil (the figure (Figure 1)). The coil is pulled out at a steady rate of 2.00 cm/s traveling perpendicular to the field lines. The region of the field ends abruptly as shown. Find the emf induced in this coil when it is all inside the field, when it is partly in the field, and when it is fully outside. Please show all steps.arrow_forwardA rectangular circuit is moved at a constant velocity of 3.00 m/s into, through, and then out of a uniform 1.25 T magnetic field, as shown in the figure (Figure 1). The magnetic field region is considerably wider than 50.0 cm . Find the direction (clockwise or counterclockwise) of the current induced in the circuit as it is going into the magnetic field (the first case), totally within the magnetic field but still moving (the second case), and moving out of the field (the third case). Find the magnitude of the current induced in the circuit as it is going into the magnetic field . Find the magnitude of the current induced in the circuit as it is totally within the magnetic field but still moving. Find the magnitude of the current induced in the circuit as it is moving out of the field. Please show all stepsarrow_forwardShrinking Loop. A circular loop of flexible iron wire has an initial circumference of 161 cm , but its circumference is decreasing at a constant rate of 15.0 cm/s due to a tangential pull on the wire. The loop is in a constant uniform magnetic field of magnitude 1.00 T , which is oriented perpendicular to the plane of the loop. Assume that you are facing the loop and that the magnetic field points into the loop. Find the magnitude of the emf E induced in the loop after exactly time 9.00 s has passed since the circumference of the loop started to decrease. Find the direction of the induced current in the loop as viewed looking along the direction of the magnetic field. Please explain all stepsarrow_forward
 Physics for Scientists and Engineers with Modern ...PhysicsISBN:9781337553292Author:Raymond A. Serway, John W. JewettPublisher:Cengage Learning
 Glencoe Physics: Principles and Problems, Student...PhysicsISBN:9780078807213Author:Paul W. ZitzewitzPublisher:Glencoe/McGraw-Hill
 An Introduction to Physical SciencePhysicsISBN:9781305079137Author:James Shipman, Jerry D. Wilson, Charles A. Higgins, Omar TorresPublisher:Cengage Learning
 College PhysicsPhysicsISBN:9781305952300Author:Raymond A. Serway, Chris VuillePublisher:Cengage Learning
 Physics for Scientists and Engineers: Foundations...PhysicsISBN:9781133939146Author:Katz, Debora M.Publisher:Cengage Learning
 College PhysicsPhysicsISBN:9781938168000Author:Paul Peter Urone, Roger HinrichsPublisher:OpenStax College