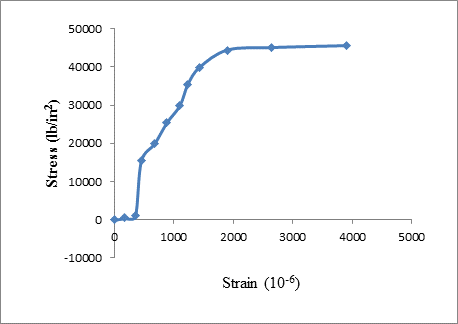
The results of a tensile test are shown in Table 1.5.2. The test was performed on a metal specimen with a circular cross section. The diameter was
a. Use the data in Table 1.5.2 to produce a table of stress and strain values.
b. Plot the stress-strain data and draw a best-fit curve.
c. Compute the, modulus of elasticity from the initial slope of the curve.
d. Estimate the yield stress.

Trending nowThis is a popular solution!

Chapter 1 Solutions
Bundle: Steel Design, Loose-leaf Version, 6th + Mindtap Engineering, 1 Term (6 Months) Printed Access Card
Additional Engineering Textbook Solutions
Vector Mechanics For Engineers
Concepts Of Programming Languages
Modern Database Management
Automotive Technology: Principles, Diagnosis, And Service (6th Edition) (halderman Automotive Series)
HEAT+MASS TRANSFER:FUND.+APPL.
- : A 5ms- long current pulse is desired for two linear lamps connected in series and pumped at a total energy input of (1KJ). Each of lamps has an arc-length of (10cm) and a bore of (1cm). If we assume a peak current of (i, -650A). Design a multiple mesh network including number of LC sections, inductance and capacitance per section and capacitor voltage. Laser designarrow_forwardWhat would be the best way to handle when a contractor misses a concrete pour deadline which causes delays for other contractors?arrow_forwardPlease solve manuallyarrow_forward
- . The free fall distance was 1753 mm. The times for the release and catch recorded on the fall experiments were in millisecond: 222.22 800.00 61.11 641.67 0.00 588.89 11.11 588.89 8.33 588.89 11.11 588.89 5.56 586.11 2.78 583.33 Calculate the time taken for the fall for each experiment. Calculate for each fall the acceleration based on time and distance. Calculate the mean of the accelerations. Give in the answer window the calculated mean of accelerations in m/s2.arrow_forwardneed help. explain plzarrow_forward-Design the traffic signal intersection using all red 2 second, for all phase the truck percent 5% for all movement, and PHF -0.95 Check for capacity only Approach Through volume Right volume Left volume Lane width Number of lane Veh/hr Veh/hr Veh/hr m North 700 100 150 3.0 3 south 600 75 160 3.0 3 East 300 80 50 4.0 R west 400 50 55 4.0 2arrow_forward
- need helparrow_forwardFor the beam show below, draw A.F.D, S.F.D, B.M.D A 2 N M 10 kN.m B 2 M Carrow_forwardB: Find the numerical solution for the 2D equation below and calculate the temperature values for each grid point shown in Fig. 2 (show all steps). (Do only one trail using following initial values and show the final matrix) T₂ 0 T3 0 I need a real solution, not artificial intelligence locarrow_forward
- : +0 العنوان use only Two rods fins) having same dimensions, one made orass (k = 85 Wm K) and the mer of copper (k = 375 W/m K), having of their ends inserted into a furna. At a section 10.5 cm a way from furnace, the temperature of brass rod 120 Find the distance at which the ame temperature would be reached in the per rod ? both ends are ex osed to the same environment. ns 2.05 ۲/۱ ostrararrow_forwardI need a real solution, not artificial intelligencearrow_forwardI need detailed help solving this exercise from homework of Applied Mechanics. I do not really understand how to do, please do it step by step, not that long but clear. Thank you!arrow_forward
 Steel Design (Activate Learning with these NEW ti...Civil EngineeringISBN:9781337094740Author:Segui, William T.Publisher:Cengage Learning
