Concept explainers
Videos
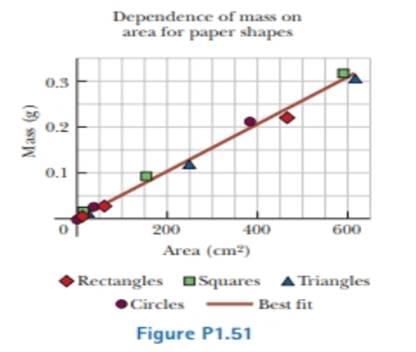
Review. A student is supplied with a stack of copy paper, ruler, compass, scissors, and a sensitive balance. He cuts out various shapes in various sizes, calculates their areas, measures their masses, and prepares the graph of Figure PI.51. (a) Consider the fourth experimental point from the top. How far is it from the best-lit straight line? Express your answer as a difference in vertical-axis coordinate, (b) Express your answer as a percentage, (c) Calculate the slope of the line, (d) State what the graph demonstrates, referring to the shape of the graph and the results of parts (b) and (c). (e) Describe whether this result should be expected theoretically, (f) Describe the physical meaning of the slope.
(a)
The distance of the fourth experimental point from the top from the best –fit straight line.
Answer to Problem 1.51P
The distance of the fourth experimental point from the top from the best fit straight line is
Explanation of Solution
Given data: The student is supplied with a stack of copy paper, ruler, compass, scissors, and a sensitive balance. A graph mass versus area is plotted for different sizes of the paper.
Consider the following figure.
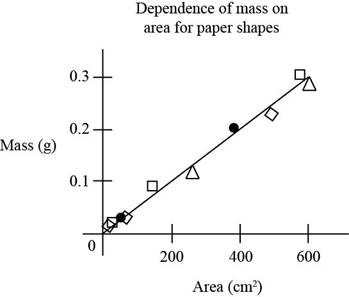
Figure (1)
Figure indicates the graph plotted area of pieces versus mass of the pieces of the paper.
The fourth experimental point from the top is a circle. It lies slightly above the best fit line.
From figure (1), the vertical coordinate for the forth experiment is
So the difference in the vertical axis coordinate is,
Here,
Substitute
Conclusion:
Therefore the distance of the fourth experimental point from the top from the best fit straight line is
(b)
The answer in the form of percentage.
Answer to Problem 1.51P
The answer in the form of percentage is
Explanation of Solution
Given data: The student is supplied with a stack of copy paper, ruler, compass, scissors, and a sensitive balance. A graph mass versus area is plotted for different sizes of the paper.
The expression for the percentage is,
Substitute
Conclusion:
Therefore the answer in the form of percentage is
(c)
The slope of the line.
Answer to Problem 1.51P
The slope of the line is
Explanation of Solution
Given data: The student is supplied with a stack of copy paper, ruler, compass, scissors, and a sensitive balance. A graph mass versus area is plotted for different sizes of the paper.
The expression for the slope is,
Here,
Substitute
Conclusion:
Therefore the slope of the line is
(d)
The demonstration from the graph referring to the shape of the graph and the results of part (b) and (c).
Answer to Problem 1.51P
The graph demonstrates that the mass of the cutout is proportional to its area for the shape cuts from this copy paper and the proportionality constant is
Explanation of Solution
Given data: The student is supplied with a stack of copy paper, ruler, compass, scissors, and a sensitive balance. A graph mass versus area is plotted for different sizes of the paper.
The graph given figure (1) demonstrates that the mass of the cutout in each shape is proportional to its area for the shape cuts from this copy paper and the proportionality constant is
The value of the slope from part (c) of the question and from the part (b) question the percentage uncertainty is
Conclusion:
Therefore the graph demonstrates that the mass of the cutout is proportional to its area for the shape cuts from this copy paper and the proportionality constant is
(e)
Whether this result should be expected theoretically or not.
Answer to Problem 1.51P
This result is to be expected theoretically if the paper has thickness and density that are uniform within the experimental uncertainty.
Explanation of Solution
Given data: The student is supplied with a stack of copy paper, ruler, compass, scissors, and a sensitive balance. A graph mass versus area is plotted for different sizes of the paper.
The graph given figure (1) demonstrates that the mass of the cutout in each shape is proportional to its area for the shape cuts from this copy paper and the proportionality constant is
The value of the slope from part (c) of the question is
Thus this result is expected theoretically when the object is having same aerial mass density and the paper has thickness and density that are uniform within the experimental uncertainty.
Conclusion:
Therefore this result is to be expected theoretically if the paper has thickness and density that are uniform within the experimental uncertainty.
(f)
The physical meaning of the slope.
Answer to Problem 1.51P
The physical meaning of the slope is the aerial density of the paper that represents the mass per unit area.
Explanation of Solution
Given data: The student is supplied with a stack of copy paper, ruler, compass, scissors, and a sensitive balance. A graph mass versus area is plotted for different sizes of the paper.
The graph given figure (1) demonstrates that the mass of the cutout in each shape is proportional to its area for the shape cuts from this copy paper and the proportionality constant is
The value of the slope from part (c) of the question is
The physical meaning of the slope is the aerial density of the paper that represent the mass per unit area.
Conclusion:
Therefore the physical meaning of the slope is the aerial density of the paper that represents the mass per unit area.
Want to see more full solutions like this?
Chapter 1 Solutions
Physics for Scientists and Engineers, Technology Update, Hybrid Edition (with Enhanced WebAssign Multi-Term LOE Printed Access Card for Physics)
Additional Science Textbook Solutions
Biology: Concepts and Investigations
Applications and Investigations in Earth Science (9th Edition)
Biology: Life on Earth (11th Edition)
Organic Chemistry
Fundamentals Of Thermodynamics
Laboratory Manual For Human Anatomy & Physiology


- 2.) A 50.0 resistor is connected to a cell of emf 3.00 V. The voltmeter and the ammeter in the circuit are ideal. V A 50.00 (a) The current in the ammeter is 59.0 mA. Calculate the internal resistance of the cell. The circuit is changed by connecting another resistor R in parallel to the 50.0 resistor. V A 50.00 R (b) Explain the effect of this change on R is made of a resistive wire of uniform cross-sectional area 3.1 × 10⁻⁸ m², resistivity 4.9 × 10-70m and length L. The resistance of R is given by the equation R = KL where k is a constant. (b.i) the reading of the ammeter. [2] (b.ii) the reading of the voltmeter. [2] (c) Calculate k. State an appropriate unit for your answer. [3] [2]arrow_forwardNo chatgpt pls will upvotearrow_forwardNo chatgpt pls will upvotearrow_forward
- A rod 12.0 cm long is uniformly charged and has a total charge of -20.0 μc. Determine the magnitude and direction of the electric field along the axis of the rod at a point 32.0 cm from its center. 361000 ☑ magnitude What is the general expression for the electric field along the axis of a uniform rod? N/C direction toward the rodarrow_forwardA certain brand of freezer is advertised to use 730 kW h of energy per year. Part A Assuming the freezer operates for 5 hours each day, how much power does it require while operating? Express your answer in watts. ΜΕ ΑΣΦ ? P Submit Request Answer Part B W If the freezer keeps its interior at a temperature of -6.0° C in a 20.0° C room, what is its theoretical maximum performance coefficient? Enter your answer numerically. K = ΜΕ ΑΣΦ Submit Request Answer Part C What is the theoretical maximum amount of ice this freezer could make in an hour, starting with water at 20.0°C? Express your answer in kilograms. m = Ο ΑΣΦ kgarrow_forwardDescribe the development of rational choice theory in sociology. Please includearrow_forward
- A-E pleasearrow_forwardA 11.8 L gas tank containing 3.90 moles of ideal He gas at 26.0°C is placed inside a completely evacuated insulated bell jar of volume 39.0 L .A small hole in the tank allows the He to leak out into the jar until the gas reaches a final equilibrium state with no more leakage. Part A What is the change in entropy of this system due to the leaking of the gas? ■ ΜΕ ΑΣΦ AS = ? J/K Submit Request Answer Part B Is the process reversible or irreversible?arrow_forwardA-E pleasearrow_forward
- Three moles of an ideal gas undergo a reversible isothermal compression at 20.0° C. During this compression, 1900 J of work is done on the gas. For related problem-solving tips and strategies, you may want to view a Video Tutor Solution of Entropy change in a free expansion. Part A What is the change of entropy of the gas? ΤΕ ΑΣΦ AS = Submit Request Answer J/Karrow_forward5.97 Block A, with weight 3w, slides down an inclined plane S of slope angle 36.9° at a constant speed while plank B, with weight w, rests on top of A. The plank is attached by a cord to the wall (Fig. P5.97). (a) Draw a diagram of all the forces acting on block A. (b) If the coefficient of kinetic friction is the same between A and B and between S and A, determine its value. Figure P5.97 B A S 36.9°arrow_forwardPlease take your time and solve each part correctly please. Thank you!!arrow_forward
 College PhysicsPhysicsISBN:9781305952300Author:Raymond A. Serway, Chris VuillePublisher:Cengage Learning
 University Physics Volume 1PhysicsISBN:9781938168277Author:William Moebs, Samuel J. Ling, Jeff SannyPublisher:OpenStax - Rice University
 Principles of Physics: A Calculus-Based TextPhysicsISBN:9781133104261Author:Raymond A. Serway, John W. JewettPublisher:Cengage Learning
 Physics for Scientists and Engineers: Foundations...PhysicsISBN:9781133939146Author:Katz, Debora M.Publisher:Cengage Learning
 Classical Dynamics of Particles and SystemsPhysicsISBN:9780534408961Author:Stephen T. Thornton, Jerry B. MarionPublisher:Cengage Learning
 Physics for Scientists and EngineersPhysicsISBN:9781337553278Author:Raymond A. Serway, John W. JewettPublisher:Cengage Learning