
Essentials of Modern Business Statistics with Microsoft Office Excel (Book Only)
7th Edition
ISBN: 9781337681643
Author: David R. Anderson; Dennis J. Sweeney; Thomas A. Williams
Publisher: Cengage Learning US
expand_more
expand_more
format_list_bulleted
Videos
Textbook Question
Chapter 1, Problem 14SE
The following data show the number of rental cars in service for three rental car companies: Hertz, Avis, and Dollar, over a four-year period.
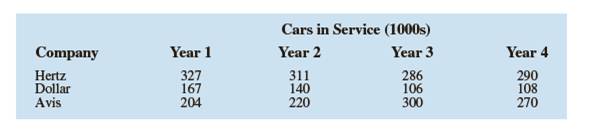
a. Construct a time series graph for the years 1 to 4 showing the number of rental cars in service for each company. Show the time series for all three companies on the same graph.
b. Comment on who appears to be the market share leader and how the market shares are changing over time.
c. Construct a bar chart showing rental cars in service for Year 4. Is this chart based on cross-sectional or time series data?
Expert Solution & Answer
Want to see the full answer?
Check out a sample textbook solution
Students have asked these similar questions
A well-known company predominantly makes flat pack furniture for students. Variability with the automated machinery means the wood components are cut with a standard deviation in length of 0.45 mm. After they are cut the components are measured. If their length is more than 1.2 mm from the required length, the components are rejected.
a) Calculate the percentage of components that get rejected.
b) In a manufacturing run of 1000 units, how many are expected to be rejected?
c) The company wishes to install more accurate equipment in order to reduce the rejection rate by one-half, using the same ±1.2mm rejection criterion. Calculate the maximum acceptable standard deviation of the new process.
5. Let X and Y be independent random variables and let the superscripts denote
symmetrization (recall Sect. 3.6). Show that
(X + Y) X+ys.
8. Suppose that the moments of the random variable X are constant, that is, suppose
that EX" =c for all n ≥ 1, for some constant c. Find the distribution of X.
Chapter 1 Solutions
Essentials of Modern Business Statistics with Microsoft Office Excel (Book Only)
Ch. 1 - Discuss the differences between statistics as...Ch. 1 - Tablet PC Comparison provides a wide variety of...Ch. 1 - Refer to Table 1. 6. a. What is the average cost...Ch. 1 - Table 1. 7 shows data for eight cordless...Ch. 1 - Refer to the data set in Table 1. 7. a. What is...Ch. 1 - J D. Power and Associates surveys new automobile...Ch. 1 - The Kroger Company is one of the largest grocery...Ch. 1 - The Tennessean, an online newspaper located in...Ch. 1 - The Commerce Department reported receiving the...Ch. 1 - The Bureau of Transportation Statistics Omnibus...
Ch. 1 - In a Gallup telephone survey conducted on April...Ch. 1 - The Hawaii Visitors Bureau collects data on...Ch. 1 - Figure 1. 10 provides a bar chart showing the...Ch. 1 - The following data show the number of rental cars...Ch. 1 - The U. S. Census Bureau tracks sales per month for...Ch. 1 - The Energy Information Administration of the U. S....Ch. 1 - A manager of a large corporation recommends a...Ch. 1 - A random telephone survey of 1021 adults (aged 18...Ch. 1 - A Bloomberg Businessweek North American subscriber...Ch. 1 - A survey of 131 investment managers in Barron 's...Ch. 1 - A seven-year medical research study reported that...Ch. 1 - A survey conducted by Better Homes and Gardens...Ch. 1 - Pew Research Center is a nonpartisan polling...Ch. 1 - A sample of midterm grades for five students...Ch. 1 - Table 1. 8 shows a data set containing information...
Knowledge Booster


Learn more about
Need a deep-dive on the concept behind this application? Look no further. Learn more about this topic, statistics and related others by exploring similar questions and additional content below.Similar questions
- 9. The concentration function of a random variable X is defined as Qx(h) = sup P(x ≤ X ≤x+h), h>0. Show that, if X and Y are independent random variables, then Qx+y (h) min{Qx(h). Qr (h)).arrow_forward10. Prove that, if (t)=1+0(12) as asf->> O is a characteristic function, then p = 1.arrow_forward9. The concentration function of a random variable X is defined as Qx(h) sup P(x ≤x≤x+h), h>0. (b) Is it true that Qx(ah) =aQx (h)?arrow_forward
- 3. Let X1, X2,..., X, be independent, Exp(1)-distributed random variables, and set V₁₁ = max Xk and W₁ = X₁+x+x+ Isk≤narrow_forward7. Consider the function (t)=(1+|t|)e, ER. (a) Prove that is a characteristic function. (b) Prove that the corresponding distribution is absolutely continuous. (c) Prove, departing from itself, that the distribution has finite mean and variance. (d) Prove, without computation, that the mean equals 0. (e) Compute the density.arrow_forward1. Show, by using characteristic, or moment generating functions, that if fx(x) = ½ex, -∞0 < x < ∞, then XY₁ - Y2, where Y₁ and Y2 are independent, exponentially distributed random variables.arrow_forward
- 1. Show, by using characteristic, or moment generating functions, that if 1 fx(x): x) = ½exarrow_forward1990) 02-02 50% mesob berceus +7 What's the probability of getting more than 1 head on 10 flips of a fair coin?arrow_forward9. The concentration function of a random variable X is defined as Qx(h) sup P(x≤x≤x+h), h>0. = x (a) Show that Qx+b(h) = Qx(h).arrow_forward
- Suppose that you buy a lottery ticket, and you have to pick six numbers from 1 through 50 (repetitions allowed). Which combination is more likely to win: 13, 48, 17, 22, 6, 39 or 1, 2, 3, 4, 5, 6? barrow_forward2 Make a histogram from this data set of test scores: 72, 79, 81, 80, 63, 62, 89, 99, 50, 78, 87, 97, 55, 69, 97, 87, 88, 99, 76, 78, 65, 77, 88, 90, and 81. Would a pie chart be appropriate for this data? ganizing Quantitative Data: Charts and Graphs 45arrow_forward10 Meteorologists use computer models to predict when and where a hurricane will hit shore. Suppose they predict that hurricane Stat has a 20 percent chance of hitting the East Coast. a. On what info are the meteorologists basing this prediction? b. Why is this prediction harder to make than your chance of getting a head on your next coin toss? U anoiaarrow_forward
arrow_back_ios
SEE MORE QUESTIONS
arrow_forward_ios
Recommended textbooks for you
 MATLAB: An Introduction with ApplicationsStatisticsISBN:9781119256830Author:Amos GilatPublisher:John Wiley & Sons Inc
 Probability and Statistics for Engineering and th...StatisticsISBN:9781305251809Author:Jay L. DevorePublisher:Cengage Learning
 Statistics for The Behavioral Sciences (MindTap C...StatisticsISBN:9781305504912Author:Frederick J Gravetter, Larry B. WallnauPublisher:Cengage Learning
 Elementary Statistics: Picturing the World (7th E...StatisticsISBN:9780134683416Author:Ron Larson, Betsy FarberPublisher:PEARSON
 The Basic Practice of StatisticsStatisticsISBN:9781319042578Author:David S. Moore, William I. Notz, Michael A. FlignerPublisher:W. H. Freeman
 Introduction to the Practice of StatisticsStatisticsISBN:9781319013387Author:David S. Moore, George P. McCabe, Bruce A. CraigPublisher:W. H. Freeman
MATLAB: An Introduction with Applications
Statistics
ISBN:9781119256830
Author:Amos Gilat
Publisher:John Wiley & Sons Inc
Probability and Statistics for Engineering and th...
Statistics
ISBN:9781305251809
Author:Jay L. Devore
Publisher:Cengage Learning
Statistics for The Behavioral Sciences (MindTap C...
Statistics
ISBN:9781305504912
Author:Frederick J Gravetter, Larry B. Wallnau
Publisher:Cengage Learning
Elementary Statistics: Picturing the World (7th E...
Statistics
ISBN:9780134683416
Author:Ron Larson, Betsy Farber
Publisher:PEARSON
The Basic Practice of Statistics
Statistics
ISBN:9781319042578
Author:David S. Moore, William I. Notz, Michael A. Fligner
Publisher:W. H. Freeman
Introduction to the Practice of Statistics
Statistics
ISBN:9781319013387
Author:David S. Moore, George P. McCabe, Bruce A. Craig
Publisher:W. H. Freeman
Time Series Analysis Theory & Uni-variate Forecasting Techniques; Author: Analytics University;https://www.youtube.com/watch?v=_X5q9FYLGxM;License: Standard YouTube License, CC-BY
Operations management 101: Time-series, forecasting introduction; Author: Brandoz Foltz;https://www.youtube.com/watch?v=EaqZP36ool8;License: Standard YouTube License, CC-BY