You would like to determine if there is a statistical relationship between the amount of caffein in a cup of coffee and their sales at their coffee franchises. The data is included in the set "Coffee by the Cup". Here is information about the variables. Variable Caffeine Cups Sold Measurement Amount of caffeine in one cup Number of cups of the coffee sold at all of the franchises Units Milligrams Cups sold a. Which variable is the explanatory variable and which variable is the response variable? b. Construct a scatterplot of the data. Based upon the scatterplot is there a linear relationship between the amount of caffeine in one cup of the coffee and the number of cups of coffee sold? Justify your reasoning using the scatterplot. c. Run a t-test for correlation using technology. Make sure you include the p-value and the printout. According to the t-test, is there a statistical relationship between the amount of caffeine in a cup of coffee and the number of cups sold? Justify your reasoning using the results of the test.
Correlation
Correlation defines a relationship between two independent variables. It tells the degree to which variables move in relation to each other. When two sets of data are related to each other, there is a correlation between them.
Linear Correlation
A correlation is used to determine the relationships between numerical and categorical variables. In other words, it is an indicator of how things are connected to one another. The correlation analysis is the study of how variables are related.
Regression Analysis
Regression analysis is a statistical method in which it estimates the relationship between a dependent variable and one or more independent variable. In simple terms dependent variable is called as outcome variable and independent variable is called as predictors. Regression analysis is one of the methods to find the trends in data. The independent variable used in Regression analysis is named Predictor variable. It offers data of an associated dependent variable regarding a particular outcome.

a)
In the above example number of cups of the coffee sold is the response variable and amount of caffeine in a cup is the explanatory variable. as we wanted to study the statistical relationship between number of coffee sold and amount of caffeine .
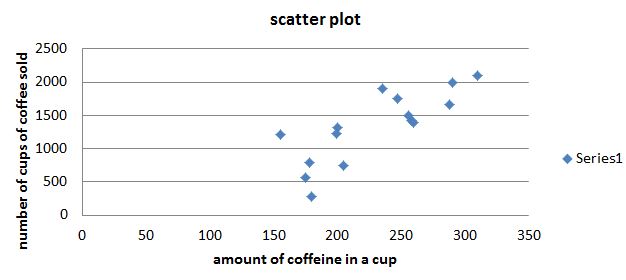
b) scatter plot -

from the scatter plot we can see that there is linear relation between number of cups of coffee sold and amount of caffeine in a cup . as we can see there is no specifics patterns . if we draw a line passing through the observations most of the points may be pass through it .
c)
we want to test the significance of the correlation between there two variable.
let us define the null and alternative hypothesis.
level of significance=0.05
correlation coefficient =0.8021
n=15
The sample size is , so then the number of degrees of freedom is
test statistics:
Step by step
Solved in 3 steps with 1 images


