You wish to test the following claim (HaHa) at a significance level of α=0.01. For the context of this problem, μd=μ2−μ1 where the first data set represents a pre-test and the second data set represents a post-test. Ho:μd=0 Ha:μd≠0You believe the population of difference scores is normally distributed, but you do not know the standard deviation. You obtain the following sample of data: pre-test post-test 62 54.8 43.7 37.7 67.2 46 59.9 33.2 37.5 44.9 30.6 24 49 41.2 What is the critical value for this test? (Report answer accurate to three decimal places.)critical value = ±What is the test statistic for this sample? (Report answer accurate to three decimal places.)test statistic =


You wish to test the following claim (HaHa) at a significance level of α=0.01. For the context of this problem, μd=μ2−μ1 where the first data set represents a pre-test and the second data set represents a post-test.
Ho:μd=0
Ha:μd≠0
You believe the population of difference scores is
| pre-test | post-test |
|---|---|
| 62 | 54.8 |
| 43.7 | 37.7 |
| 67.2 | 46 |
| 59.9 | 33.2 |
| 37.5 | 44.9 |
| 30.6 | 24 |
| 49 | 41.2 |
What is the critical value for this test? (Report answer accurate to three decimal places.)
critical value = ±
What is the test statistic for this sample? (Report answer accurate to three decimal places.)
test statistic =
Step-by-step procedure to obtain the test statistic and critical-value using Excel:
- In Excel sheet, enter Pre-test in one column and enter Post-test in one column.
- In Data, select Data Analysis and choose t-test; Paired Two samples for means.
- In Input Variable 1 Range, select Post-test.
- In Input Variable 2 Range, select Pre-test.
- In Hypothesized Mean Difference, enter 0.
- Enter 01 under Alpha and click Labels.
- Click Ok.
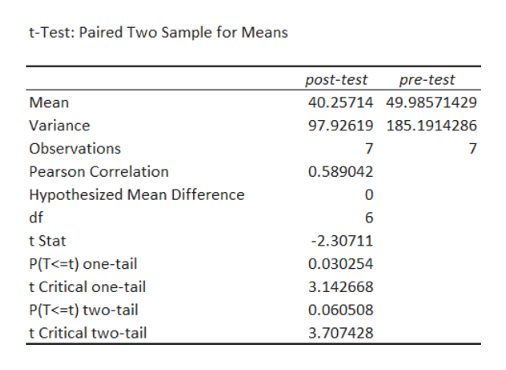
Output obtained using Excel is given below:

Trending now
This is a popular solution!

Step by step
Solved in 3 steps with 1 images


