You wish to test the following claim (Ha) at a significance level of a = 0.05. Ho:p = 0.26 Ha:p + 0.26 а You obtain a sample of size n = 568 in which there are 179 successful observations. What is the test statistic for this sample? (Report answer accurate to three decimal places.) test statistic What is the p-value for this sample? (Report answer accurate to four decimal places.) p-value : %3D The p-value is... less than (or equal to) a greater than a
You wish to test the following claim (Ha) at a significance level of a = 0.05. Ho:p = 0.26 Ha:p + 0.26 а You obtain a sample of size n = 568 in which there are 179 successful observations. What is the test statistic for this sample? (Report answer accurate to three decimal places.) test statistic What is the p-value for this sample? (Report answer accurate to four decimal places.) p-value : %3D The p-value is... less than (or equal to) a greater than a

MATLAB: An Introduction with Applications
6th Edition
ISBN:9781119256830
Author:Amos Gilat
Publisher:Amos Gilat
Chapter1: Starting With Matlab
Section: Chapter Questions
Problem 1P

Related questions
Question

Transcribed Image Text:This test statistic leads to a decision to...
Reject the null
Accept the null
Do not reject the null
As such, the final conclusion is that...
There is sufficient evidence to warrant rejection of
the claim that the population proportion is not equal
to 0.26.
O There is not sufficient evidence to warrant
rejection of the claim that the population proportion
is not equal to 0.26.
The sample data support the claim that the
population proportion is not equal to 0.26.
There is not sufficient sample evidence to support
the claim that the population proportion is not equal
to 0.26.

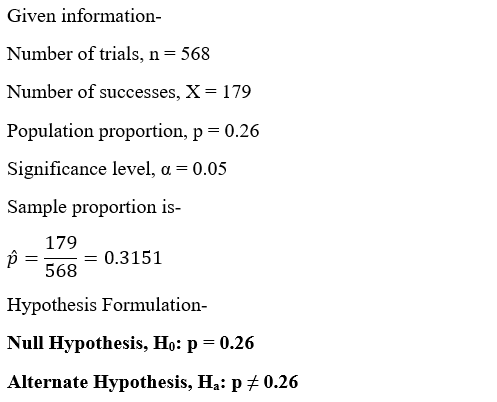
Transcribed Image Text:You wish to test the following claim (Ha) at a significance
level of a =
0.05.
Ho:p = 0.26
Ha:p + 0.26
а
You obtain a sample of size n =
568 in which there are
179 successful observations.
What is the test statistic for this sample? (Report answer
accurate to three decimal places.)
test statistic =
What is the p-value for this sample? (Report answer
accurate to four decimal places.)
p-value =
The p-value is...
less than (or equal to) a
O greater than a
Expert Solution
Step 1

Step by step
Solved in 2 steps with 2 images

Recommended textbooks for you
MATLAB: An Introduction with Applications
Statistics
ISBN:
9781119256830
Author:
Amos Gilat
Publisher:
John Wiley & Sons Inc

Probability and Statistics for Engineering and th…
Statistics
ISBN:
9781305251809
Author:
Jay L. Devore
Publisher:
Cengage Learning

Statistics for The Behavioral Sciences (MindTap C…
Statistics
ISBN:
9781305504912
Author:
Frederick J Gravetter, Larry B. Wallnau
Publisher:
Cengage Learning
MATLAB: An Introduction with Applications
Statistics
ISBN:
9781119256830
Author:
Amos Gilat
Publisher:
John Wiley & Sons Inc
Probability and Statistics for Engineering and th…
Statistics
ISBN:
9781305251809
Author:
Jay L. Devore
Publisher:
Cengage Learning
Statistics for The Behavioral Sciences (MindTap C…
Statistics
ISBN:
9781305504912
Author:
Frederick J Gravetter, Larry B. Wallnau
Publisher:
Cengage Learning

Elementary Statistics: Picturing the World (7th E…
Statistics
ISBN:
9780134683416
Author:
Ron Larson, Betsy Farber
Publisher:
PEARSON

The Basic Practice of Statistics
Statistics
ISBN:
9781319042578
Author:
David S. Moore, William I. Notz, Michael A. Fligner
Publisher:
W. H. Freeman

Introduction to the Practice of Statistics
Statistics
ISBN:
9781319013387
Author:
David S. Moore, George P. McCabe, Bruce A. Craig
Publisher:
W. H. Freeman