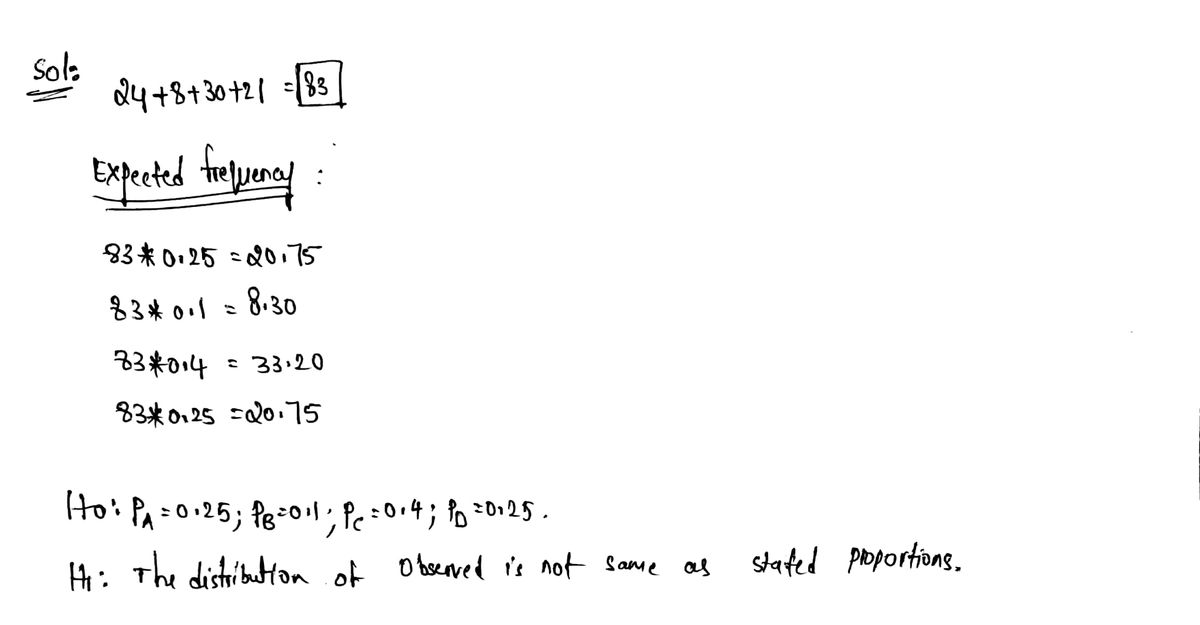
You are conducting a multinomial Goodness of Fit hypothesis test for the claim that the 4 categories occur with the following frequencies: Ho: PA= 0.25; PB = 0.1; pc = 0.4; pp = 0.25 Complete the table. Report all answers accurate to three decimal places. Category Observed Expected Frequency Frequency A B 00 с D 24 8 30 21
You are conducting a multinomial Goodness of Fit hypothesis test for the claim that the 4 categories occur with the following frequencies: Ho: PA= 0.25; PB = 0.1; pc = 0.4; pp = 0.25 Complete the table. Report all answers accurate to three decimal places. Category Observed Expected Frequency Frequency A B 00 с D 24 8 30 21

MATLAB: An Introduction with Applications
6th Edition
ISBN:9781119256830
Author:Amos Gilat
Publisher:Amos Gilat
Chapter1: Starting With Matlab
Section: Chapter Questions
Problem 1P

Related questions
Question
Images may not be in order. Sorry about that.

Transcribed Image Text:You are conducting a multinomial Goodness of Fit hypothesis test for the claim that the 4 categories occur
with the following frequencies:
Ho: PA=0.25; PB = 0.1; pc = 0.4; PD = 0.25
Complete the table. Report all answers accurate to three decimal places.
Expected
Category
Observed
Frequency Frequency
A
B
00
с
D
24
8
30
21
What is the chi-square test-statistic for this data? (2 decimal places)
x² =

Transcribed Image Text:What is the P-Value? (3 decimal places)
P-Value =
For significance level alpha 0.025,
What would be the conclusion of this hypothesis test?
Fail to reject the Null Hypothesis
Reject the Null Hypothesis
Report all answers accurate to three decimal places.
Expert Solution
Step 1

Trending now
This is a popular solution!

Step by step
Solved in 3 steps with 2 images

Recommended textbooks for you
MATLAB: An Introduction with Applications
Statistics
ISBN:
9781119256830
Author:
Amos Gilat
Publisher:
John Wiley & Sons Inc

Probability and Statistics for Engineering and th…
Statistics
ISBN:
9781305251809
Author:
Jay L. Devore
Publisher:
Cengage Learning

Statistics for The Behavioral Sciences (MindTap C…
Statistics
ISBN:
9781305504912
Author:
Frederick J Gravetter, Larry B. Wallnau
Publisher:
Cengage Learning
MATLAB: An Introduction with Applications
Statistics
ISBN:
9781119256830
Author:
Amos Gilat
Publisher:
John Wiley & Sons Inc
Probability and Statistics for Engineering and th…
Statistics
ISBN:
9781305251809
Author:
Jay L. Devore
Publisher:
Cengage Learning
Statistics for The Behavioral Sciences (MindTap C…
Statistics
ISBN:
9781305504912
Author:
Frederick J Gravetter, Larry B. Wallnau
Publisher:
Cengage Learning

Elementary Statistics: Picturing the World (7th E…
Statistics
ISBN:
9780134683416
Author:
Ron Larson, Betsy Farber
Publisher:
PEARSON

The Basic Practice of Statistics
Statistics
ISBN:
9781319042578
Author:
David S. Moore, William I. Notz, Michael A. Fligner
Publisher:
W. H. Freeman

Introduction to the Practice of Statistics
Statistics
ISBN:
9781319013387
Author:
David S. Moore, George P. McCabe, Bruce A. Craig
Publisher:
W. H. Freeman