You are an investment analyst at FI Investments tasked to value FBC firm a Southern Agricultural Conglomerate. The following financial information was recently released for FBC. The company’s 2018 and 2017 annual financial reports are contained in tables 1 and 2 below, along with important additional information: Table 1: FBC statement of financial position (R millions) 2018 2017 Cash and equivalents R149 R83 Accounts receivable 295 265 Inventory 275 285 Total current assets R719 R633 Total fixed assets 3 909 3 856 Accounts payable 228 220 Notes payable 0 0 Total current liabilities 228 220 Long term debt 1 800 1 650 Total liabilities and shareholders equity 3 909 3 856 Number of shares outstanding (millions) 100 100 Additional information: • Depreciation (2018): R483. • The firm spent R250m in profitable projects during the course of 2018 • WACC : 15% • Cost of equity of the firm: 10% • Tax rate : 40% Table 2: FBC statement of comprehensive income (R millions except for share data) 2018 2017 Total revenues R3 175 R3 075 EBIT 495 448 Interest expense 104 101 Net Income 235 208 Dividends per share R0.80 R0.80 Use the information given, to answer the following: a) Calculate the Free Cash Flow to the Firm (FCFF) for the year 2018. b) You are told that the Free Cash Flow to Equity (FCFE) of the firm will continue to grow at a rate of 5% for the next 3 years, after which it will stabilize to a rate of 3%. Calculate the intrinsic value of each of FBC’ shares. 9 (Use 2.d.p in your calculations & final answer for this question) Requires: Net working capital (2017) Net working capital (2018) FCFF0 FCFE0 FCFE1 FCFE2 FCFE3 FCFE(t+1) Pn Value of equity Value per share


You are an investment analyst at FI Investments tasked to value FBC firm a Southern Agricultural Conglomerate. The following financial information was recently released for FBC. The company’s 2018 and 2017 annual financial reports are contained in tables 1 and 2 below, along with important additional information:
Table 1: FBC
2018 2017
Cash and equivalents R149 R83
Accounts receivable 295 265
Inventory 275 285
Total current assets R719 R633
Total fixed assets 3 909 3 856
Accounts payable 228 220
Notes payable 0 0
Total current liabilities 228 220
Long term debt 1 800 1 650
Total liabilities and shareholders equity 3 909 3 856
Number of shares outstanding (millions) 100 100
Additional information:
•
• The firm spent R250m in profitable projects during the course of 2018
• WACC : 15%
•
• Tax rate : 40%
Table 2: FBC statement of comprehensive income
(R millions except for share data)
2018 2017
Total revenues R3 175 R3 075
EBIT 495 448
Interest expense 104 101
Net Income 235 208
Dividends per share R0.80 R0.80
Use the information given, to answer the following:
a) Calculate the
b) You are told that the Free Cash Flow to Equity (FCFE) of the firm will continue to grow at a rate of 5% for the next 3 years, after which it will stabilize to a rate of 3%. Calculate the intrinsic value of each of FBC’ shares. 9 (Use 2.d.p in your calculations & final answer for this question)
Requires:
Net working capital (2017)
Net working capital (2018)
FCFF0
FCFE0
FCFE1
FCFE2
FCFE3
FCFE(t+1)
Pn
Value of equity
Value per share
Part (a):
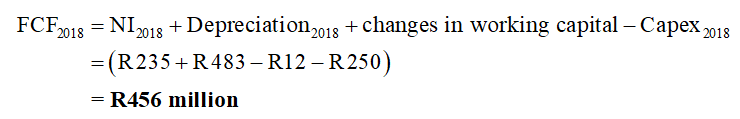
Calculation of free cash flow in 2018:
Answer:
Free cash flow in 2018 is R456 million.
Calculation of net working capital changes (in millions):
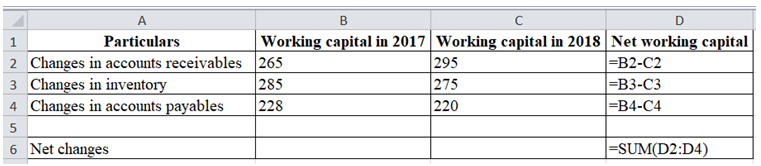
Excel spreadsheet:
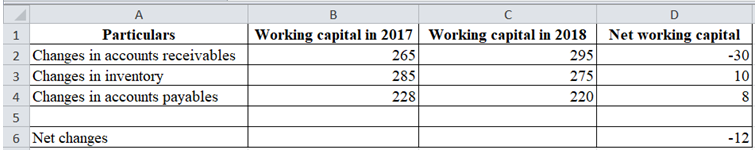
Excel workings:
Calculation of Free cash flow of the firm in 2018:

Step by step
Solved in 8 steps with 6 images


