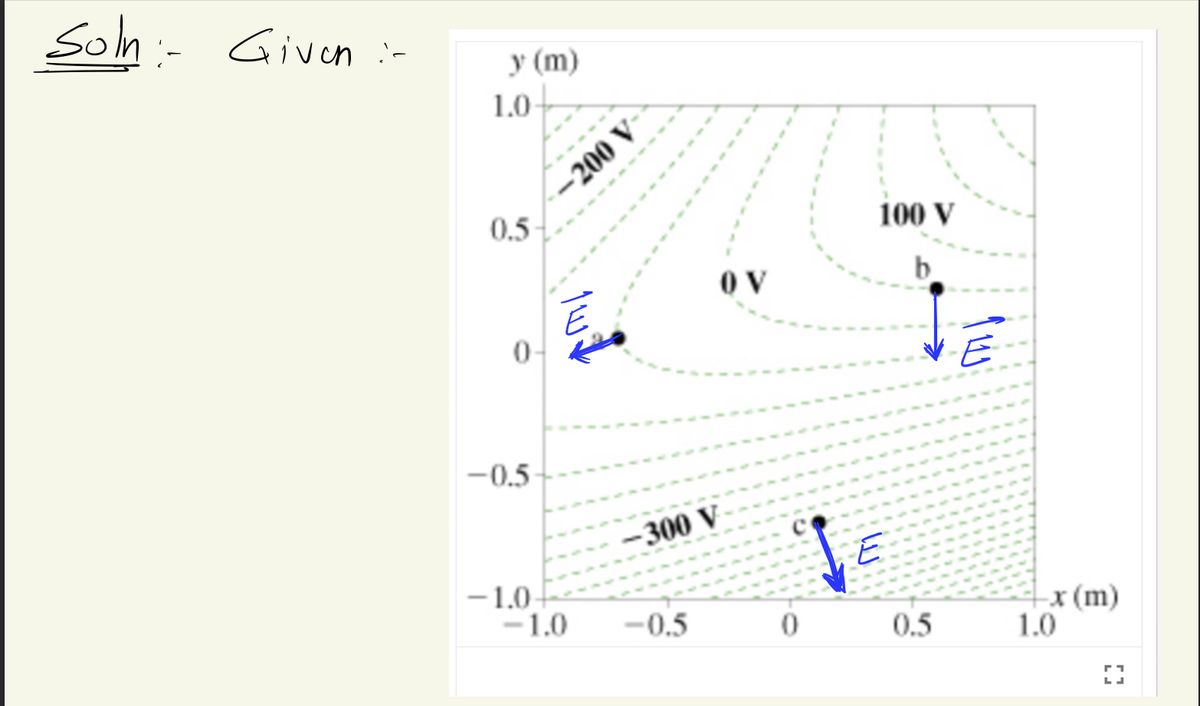
y (m) 1.0- 0.5 0 -0.5- -1.0- -200 V -1.0 a -300 V -0.5 OV 0 100 V 0.5 --x (m) 1.0
y (m) 1.0- 0.5 0 -0.5- -1.0- -200 V -1.0 a -300 V -0.5 OV 0 100 V 0.5 --x (m) 1.0
Related questions
Question
Based on the given equipotential lines, what is the direction of the electric field at point 2?
|
b |
||
|
g |
||
|
c |
||
|
h |
||
|
e |
||
|
a |
||
|
d |
||
|
f |

Transcribed Image Text:### Electric Potential Contour Map
The image presents a contour map depicting the electric potential in a given region of space, marked by equipotential lines. The x-axis is labeled as \(x\) (m) and the y-axis as \(y\) (m), with both axes ranging from -1.0 to 1.0 meters.
#### Key Features:
- **Equipotential Lines**: The green dashed lines represent equipotential lines, where the electric potential is constant. The potential values are labeled as follows:
- \(-300 \, \text{V}\)
- \(-200 \, \text{V}\)
- \(0 \, \text{V}\)
- \(100 \, \text{V}\)
- **Points of Interest**: Three specific points, labeled as a, b, and c, are plotted on the map:
- **Point a** is located around (-0.5, 0) meters, near the \(-200 \, \text{V}\) line.
- **Point b** is situated near (0.5, 0.5) meters, close to the \(100 \, \text{V}\) line.
- **Point c** is at approximately (0, -0.5) meters beside the \(-300 \, \text{V}\) line.
This map helps visualize how the electric potential varies within this space and illustrates that the potential difference between any two points on the same line is zero. Such maps are crucial in understanding electric fields, as the field lines are always perpendicular to the equipotential lines.
Expert Solution
Step 1

Step by step
Solved in 2 steps with 2 images
