Calculus: Early Transcendentals
8th Edition
ISBN:9781285741550
Author:James Stewart
Publisher:James Stewart
Chapter1: Functions And Models
Section: Chapter Questions
Problem 1RCC: (a) What is a function? What are its domain and range? (b) What is the graph of a function? (c) How...
Related questions
Question
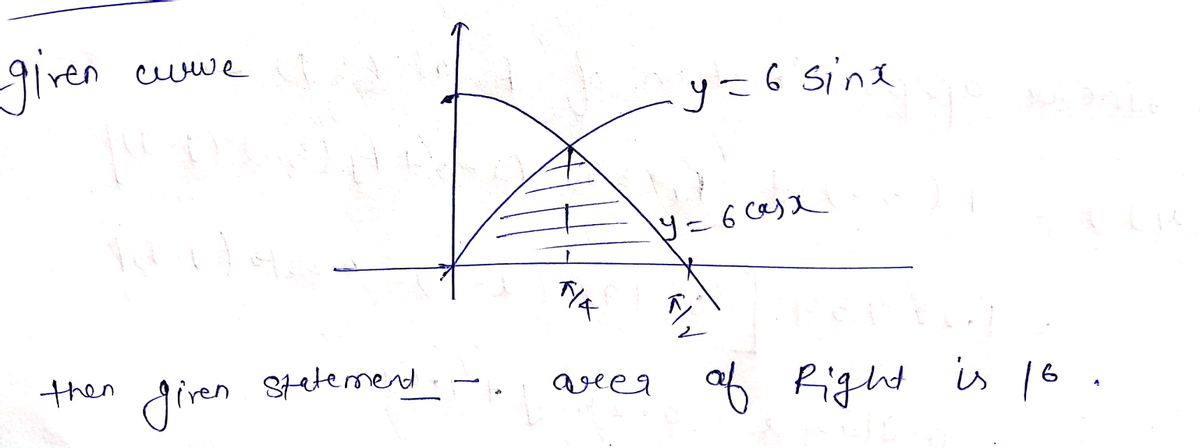
I fond the area as 16 is that right or no?

Transcribed Image Text:**Trigonometric Function Graphs**
This diagram shows the graphs of two trigonometric functions, \( y = 6 \sin x \) and \( y = 6 \cos x \), plotted on a coordinate plane.
- **Axes:**
- The horizontal axis is labeled as \( x \).
- The vertical axis is labeled as \( y \).
- **Function \( y = 6 \sin x \):**
- This function is represented by a blue curve.
- It starts at the origin \((0, 0)\), rises to a maximum of 6 at \(\frac{\pi}{2}\), and intersects the horizontal axis again at \( \pi \).
- **Function \( y = 6 \cos x \):**
- This function is represented by a red curve.
- It starts at the maximum value of 6 at \( x = 0 \), decreases to 0 at \(\frac{\pi}{2}\), and continues to decrease below the x-axis beyond the image frame.
- **Shaded Region:**
- There is a shaded triangular area between the two curves from \( x = 0 \) to \( x = \frac{\pi}{2} \). This region indicates the area where the graph of \( y = 6 \cos x \) is above the graph of \( y = 6 \sin x \).
This visual representation helps explain the behavior and intersections of the sine and cosine functions within the range from 0 to \( \frac{\pi}{2} \), showcasing their amplitude differences and phase relationships.
Expert Solution
Step 1

Step by step
Solved in 2 steps with 2 images

Recommended textbooks for you

Calculus: Early Transcendentals
Calculus
ISBN:
9781285741550
Author:
James Stewart
Publisher:
Cengage Learning

Thomas' Calculus (14th Edition)
Calculus
ISBN:
9780134438986
Author:
Joel R. Hass, Christopher E. Heil, Maurice D. Weir
Publisher:
PEARSON

Calculus: Early Transcendentals (3rd Edition)
Calculus
ISBN:
9780134763644
Author:
William L. Briggs, Lyle Cochran, Bernard Gillett, Eric Schulz
Publisher:
PEARSON

Calculus: Early Transcendentals
Calculus
ISBN:
9781285741550
Author:
James Stewart
Publisher:
Cengage Learning

Thomas' Calculus (14th Edition)
Calculus
ISBN:
9780134438986
Author:
Joel R. Hass, Christopher E. Heil, Maurice D. Weir
Publisher:
PEARSON

Calculus: Early Transcendentals (3rd Edition)
Calculus
ISBN:
9780134763644
Author:
William L. Briggs, Lyle Cochran, Bernard Gillett, Eric Schulz
Publisher:
PEARSON

Calculus: Early Transcendentals
Calculus
ISBN:
9781319050740
Author:
Jon Rogawski, Colin Adams, Robert Franzosa
Publisher:
W. H. Freeman


Calculus: Early Transcendental Functions
Calculus
ISBN:
9781337552516
Author:
Ron Larson, Bruce H. Edwards
Publisher:
Cengage Learning