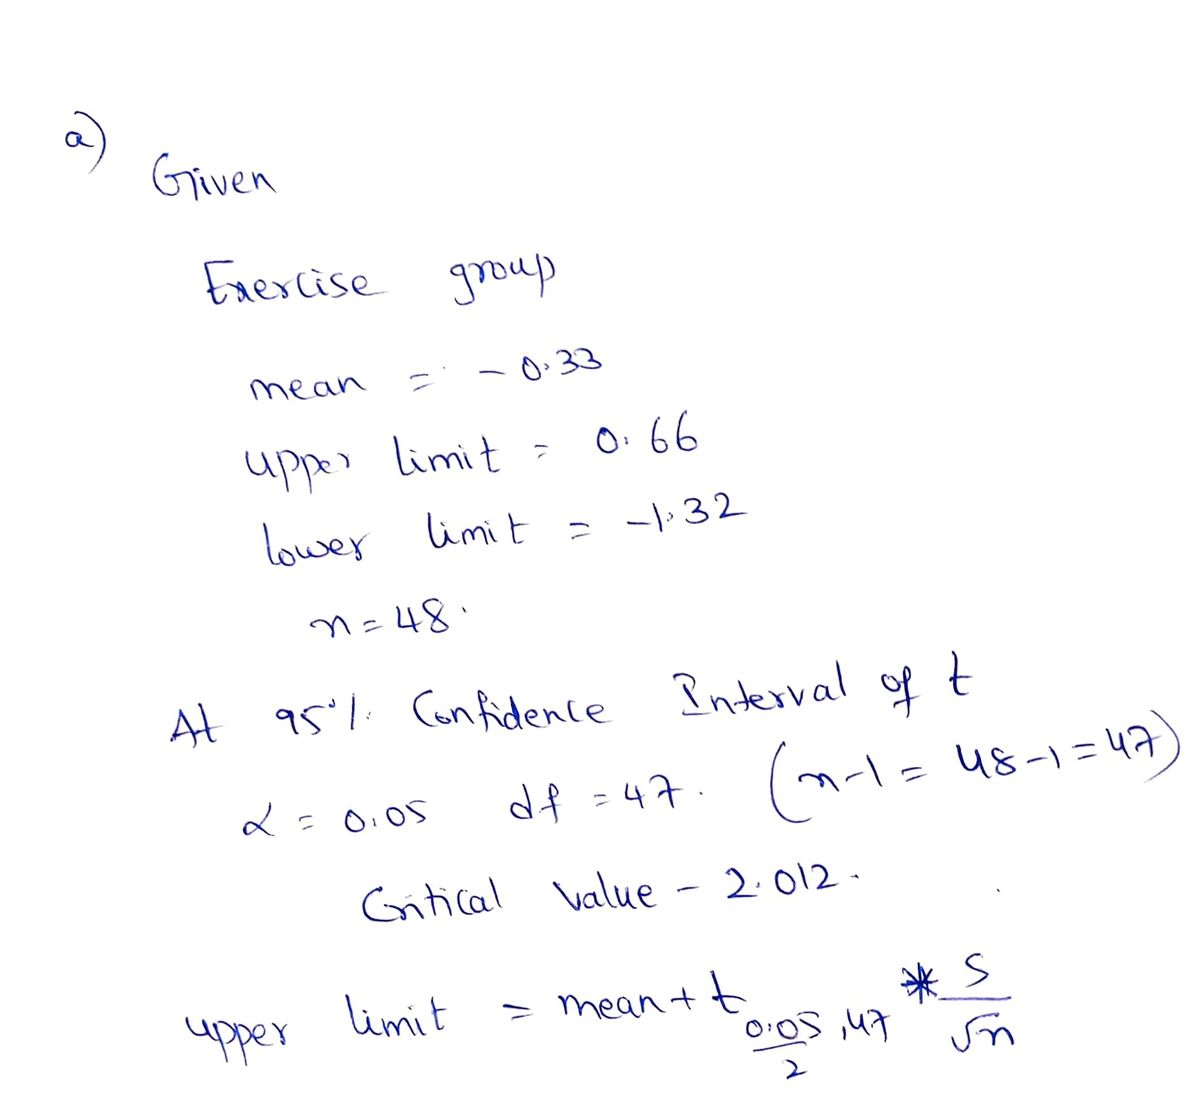
A study was performed looking at the effect of physical activity on cognitive function among adults at high risk for Alzheimer's disease. There were 170 eligible subjects randomly assigned to either an exercise intervention (exercise group) or a control intervention (control group). The subjects were followed at 6-month intervals up to 18 months of follow-up. The primary assessment scale was the Alzheimer's Disease Assessment Scale-Cognitive Subscale (ADAS-Cog). The results at 18 months of follow-up among participants with mild cognitive impairment are given in the table below. (Let population 1 be the exercise group and population 2 be the control group. Use exercise group control group.) Mean difference from baseline (18-month score minus baseline score) among participants with mild cognitive impairment in the ADAS-Cog score* Mean change 95% CI n Exercise group Control group -0.33 USE SALT (-1.32, 0.66) 48 -0.43 (-1.35, 0.49) 52 (a) What is the standard deviation of change in the exercise group? (Round your answer to three decimal places.) (b) What is the standard deviation of change in the control group? (Round your answer to three decimal places.)
A study was performed looking at the effect of physical activity on cognitive function among adults at high risk for Alzheimer's disease. There were 170 eligible subjects randomly assigned to either an exercise intervention (exercise group) or a control intervention (control group). The subjects were followed at 6-month intervals up to 18 months of follow-up. The primary assessment scale was the Alzheimer's Disease Assessment Scale-Cognitive Subscale (ADAS-Cog). The results at 18 months of follow-up among participants with mild cognitive impairment are given in the table below. (Let population 1 be the exercise group and population 2 be the control group. Use exercise group control group.) Mean difference from baseline (18-month score minus baseline score) among participants with mild cognitive impairment in the ADAS-Cog score* Mean change 95% CI n Exercise group Control group -0.33 USE SALT (-1.32, 0.66) 48 -0.43 (-1.35, 0.49) 52 (a) What is the standard deviation of change in the exercise group? (Round your answer to three decimal places.) (b) What is the standard deviation of change in the control group? (Round your answer to three decimal places.)

MATLAB: An Introduction with Applications
6th Edition
ISBN:9781119256830
Author:Amos Gilat
Publisher:Amos Gilat
Chapter1: Starting With Matlab
Section: Chapter Questions
Problem 1P

Related questions
Question
How would you find (a.) and (b.)?? As well as finding the test statistic and p-value?

Transcribed Image Text:A study was performed looking at the effect of physical activity on cognitive function among adults at high risk for Alzheimer's disease. There were 170 eligible subjects randomly assigned to either an exercise
intervention (exercise group) or a control intervention (control group). The subjects were followed at 6-month intervals up to 18 months of follow-up. The primary assessment scale was the Alzheimer's Disease
Assessment Scale-Cognitive Subscale (ADAS-Cog). The results at 18 months of follow-up among participants with mild cognitive impairment are given in the table below. (Let population 1 be the exercise group
and population 2 be the control group. Use exercise group
control group.)
Mean difference from baseline (18-month score
minus baseline score) among participants with
mild cognitive impairment in the ADAS-Cog
score*
Mean change
95% CI
Exercise group
USE SALT
-0.33
(-1.32, 0.66)
48
Control group
-0.43
(-1.35, 0.49)
52
(a) What is the standard deviation of change in the exercise group? (Round your answer to three decimal places.)
(b) What is the standard deviation of change in the control group? (Round your answer to three decimal places.)

Transcribed Image Text:What is the test statistic? (Round your answer to two decimal places.)
Use technology to find the p-value. (Round your answer to four decimal places.)
p-value
Expert Solution
Step 1

Step by step
Solved in 3 steps with 3 images

Follow-up Questions
Read through expert solutions to related follow-up questions below.
Follow-up Question
The first part to find (a.) was right, but the next part (b.) was marked wrong.
Solution
Recommended textbooks for you
MATLAB: An Introduction with Applications
Statistics
ISBN:
9781119256830
Author:
Amos Gilat
Publisher:
John Wiley & Sons Inc

Probability and Statistics for Engineering and th…
Statistics
ISBN:
9781305251809
Author:
Jay L. Devore
Publisher:
Cengage Learning

Statistics for The Behavioral Sciences (MindTap C…
Statistics
ISBN:
9781305504912
Author:
Frederick J Gravetter, Larry B. Wallnau
Publisher:
Cengage Learning
MATLAB: An Introduction with Applications
Statistics
ISBN:
9781119256830
Author:
Amos Gilat
Publisher:
John Wiley & Sons Inc
Probability and Statistics for Engineering and th…
Statistics
ISBN:
9781305251809
Author:
Jay L. Devore
Publisher:
Cengage Learning
Statistics for The Behavioral Sciences (MindTap C…
Statistics
ISBN:
9781305504912
Author:
Frederick J Gravetter, Larry B. Wallnau
Publisher:
Cengage Learning

Elementary Statistics: Picturing the World (7th E…
Statistics
ISBN:
9780134683416
Author:
Ron Larson, Betsy Farber
Publisher:
PEARSON

The Basic Practice of Statistics
Statistics
ISBN:
9781319042578
Author:
David S. Moore, William I. Notz, Michael A. Fligner
Publisher:
W. H. Freeman

Introduction to the Practice of Statistics
Statistics
ISBN:
9781319013387
Author:
David S. Moore, George P. McCabe, Bruce A. Craig
Publisher:
W. H. Freeman