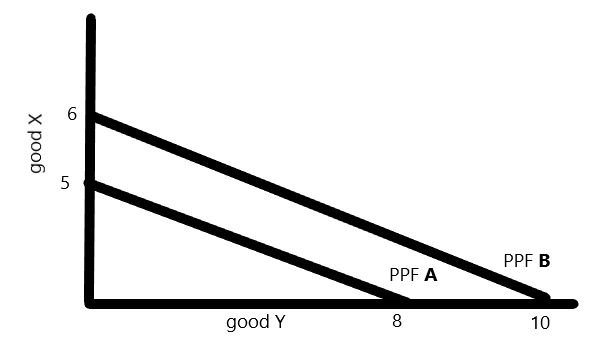
With 1 resource unit 2 countries, A and B, are each capable of producing 2 goods, X and Y, according to the following production possibilities schedule. Country / good x y A 5 8 B 6 10 Develop a production possibilities graph for country A that shows with specialization and trade country A can consume outside of its PPF
With 1 resource unit 2 countries, A and B, are each capable of producing 2 goods, X and Y, according to the following production possibilities schedule.
| Country / good | x | y |
| A | 5 | 8 |
| B | 6 | 10 |
Develop a production possibilities graph for country A that shows with specialization and trade country A can consume outside of its

In the above diagram, the PPF A represents the country's A PPF, and PPF represents the country's B PPF. Now, With 1 resource unit, country B can produce more because the PPF curve of country B lies above the PPF curve of country A PPF. This implies country B produces more having the same amount of resources available. compare to country A. The country's B PPF is unattainable for country A as it lies above the PPF A curve.
Step by step
Solved in 2 steps with 1 images


