What proportion of the ships had scores of 95 or higher? a) 0.8118 b) 0.7473 c) 0.1882 O d) 0.2796 As you may remember, several years ago the Carnival ship Triumph suffered an engine room fire that resulted in inoperable restrooms and a lack of running water for most of the ship. Suppose their revised sanitation score after this incident was reported as a 40. Previously the ship's score was a 92 (below the median value of 97 and first quartile value of 94). What will happen to the following statistics when they are recalculated with the new data value of 40? The mean will increase stay the same decrease
What proportion of the ships had scores of 95 or higher? a) 0.8118 b) 0.7473 c) 0.1882 O d) 0.2796 As you may remember, several years ago the Carnival ship Triumph suffered an engine room fire that resulted in inoperable restrooms and a lack of running water for most of the ship. Suppose their revised sanitation score after this incident was reported as a 40. Previously the ship's score was a 92 (below the median value of 97 and first quartile value of 94). What will happen to the following statistics when they are recalculated with the new data value of 40? The mean will increase stay the same decrease

MATLAB: An Introduction with Applications
6th Edition
ISBN:9781119256830
Author:Amos Gilat
Publisher:Amos Gilat
Chapter1: Starting With Matlab
Section: Chapter Questions
Problem 1P

Related questions
Question
Please see below. I need this asap please and thank you. Need these asap.

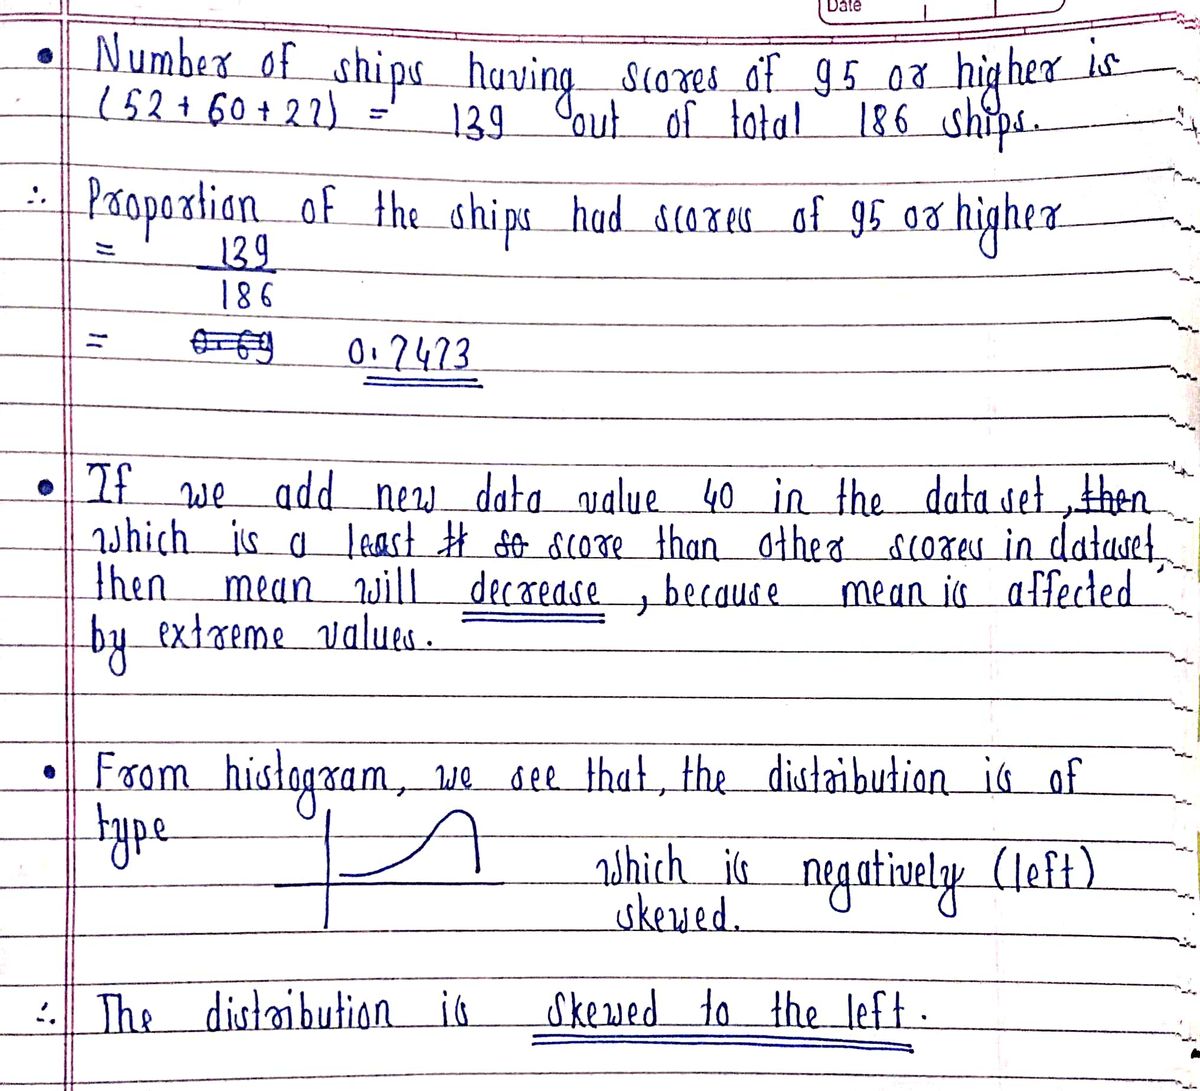
Transcribed Image Text:What proportion of the ships had scores of 95 or higher?
a) 0.8118
b) 0.7473
c) 0.1882
O d) 0.2796
As you may remember, several years ago the Carnival ship Triumph suffered an engine room fire that
resulted in inoperable restrooms and a lack of running water for most of the ship. Suppose their revised
sanitation score after this incident was reported as a 40. Previously the ship's score was a 92 (below the
median value of 97 and first quartile value of 94). What will happen to the following statistics when they are
recalculated with the new data value of 40?
The mean will
increase
stay the same
decrease

Transcribed Image Text:The histogram below gives the latest sanitation inspection scores for 186 cruise ships. A score of 86 or higher
indicates that the ship is providing an acceptable standard of sanitation.
F60
50
40
-30
20
12
10
65
70
75
80
85
90
95
100
105
The distribution is
Symmetric
Skewed to the left
Uniform
Skewed to the right
Count
Expert Solution
Step 1

Trending now
This is a popular solution!

Step by step
Solved in 2 steps with 1 images

Recommended textbooks for you
MATLAB: An Introduction with Applications
Statistics
ISBN:
9781119256830
Author:
Amos Gilat
Publisher:
John Wiley & Sons Inc

Probability and Statistics for Engineering and th…
Statistics
ISBN:
9781305251809
Author:
Jay L. Devore
Publisher:
Cengage Learning

Statistics for The Behavioral Sciences (MindTap C…
Statistics
ISBN:
9781305504912
Author:
Frederick J Gravetter, Larry B. Wallnau
Publisher:
Cengage Learning
MATLAB: An Introduction with Applications
Statistics
ISBN:
9781119256830
Author:
Amos Gilat
Publisher:
John Wiley & Sons Inc
Probability and Statistics for Engineering and th…
Statistics
ISBN:
9781305251809
Author:
Jay L. Devore
Publisher:
Cengage Learning
Statistics for The Behavioral Sciences (MindTap C…
Statistics
ISBN:
9781305504912
Author:
Frederick J Gravetter, Larry B. Wallnau
Publisher:
Cengage Learning

Elementary Statistics: Picturing the World (7th E…
Statistics
ISBN:
9780134683416
Author:
Ron Larson, Betsy Farber
Publisher:
PEARSON

The Basic Practice of Statistics
Statistics
ISBN:
9781319042578
Author:
David S. Moore, William I. Notz, Michael A. Fligner
Publisher:
W. H. Freeman

Introduction to the Practice of Statistics
Statistics
ISBN:
9781319013387
Author:
David S. Moore, George P. McCabe, Bruce A. Craig
Publisher:
W. H. Freeman