We have just conducted a study examining how much math anxiety students experience after taking a statistics class. We want to know if students on average are reporting low (1) or high (7) levels of math anxiety. To do that, we want to compare the math anxiety levels of the students after they have taken a statistics course to the average population math anxiety. We believe that the students on average will have a level of math anxiety that differs from the population. X 3 4 4 5 5 3 1 3 5 6 7 2 2 3 2 3 2 3 1 3
We have just conducted a study examining how much math anxiety students experience after taking a statistics class. We want to know if students on average are reporting low (1) or high (7) levels of math anxiety. To do that, we want to compare the math anxiety levels of the students after they have taken a statistics course to the average population math anxiety. We believe that the students on average will have a level of math anxiety that differs from the population. X 3 4 4 5 5 3 1 3 5 6 7 2 2 3 2 3 2 3 1 3

MATLAB: An Introduction with Applications
6th Edition
ISBN:9781119256830
Author:Amos Gilat
Publisher:Amos Gilat
Chapter1: Starting With Matlab
Section: Chapter Questions
Problem 1P

Related questions
Question
- A) We have just conducted a study examining how much math anxiety students experience after taking a statistics class. We want to know if students on average are reporting low (1) or high (7) levels of math anxiety. To do that, we want to compare the math anxiety levels of the students after they have taken a statistics course to the average population math anxiety. We believe that the students on average will have a level of math anxiety that differs from the population.
|
X |
|
3 |
|
4 |
|
4 |
|
5 |
|
5 |
|
3 |
|
1 |
|
3 |
|
5 |
|
6 |
|
7 |
|
2 |
|
2 |
|
3 |
|
2 |
|
3 |
|
2 |
|
3 |
|
1 |
|
3 |
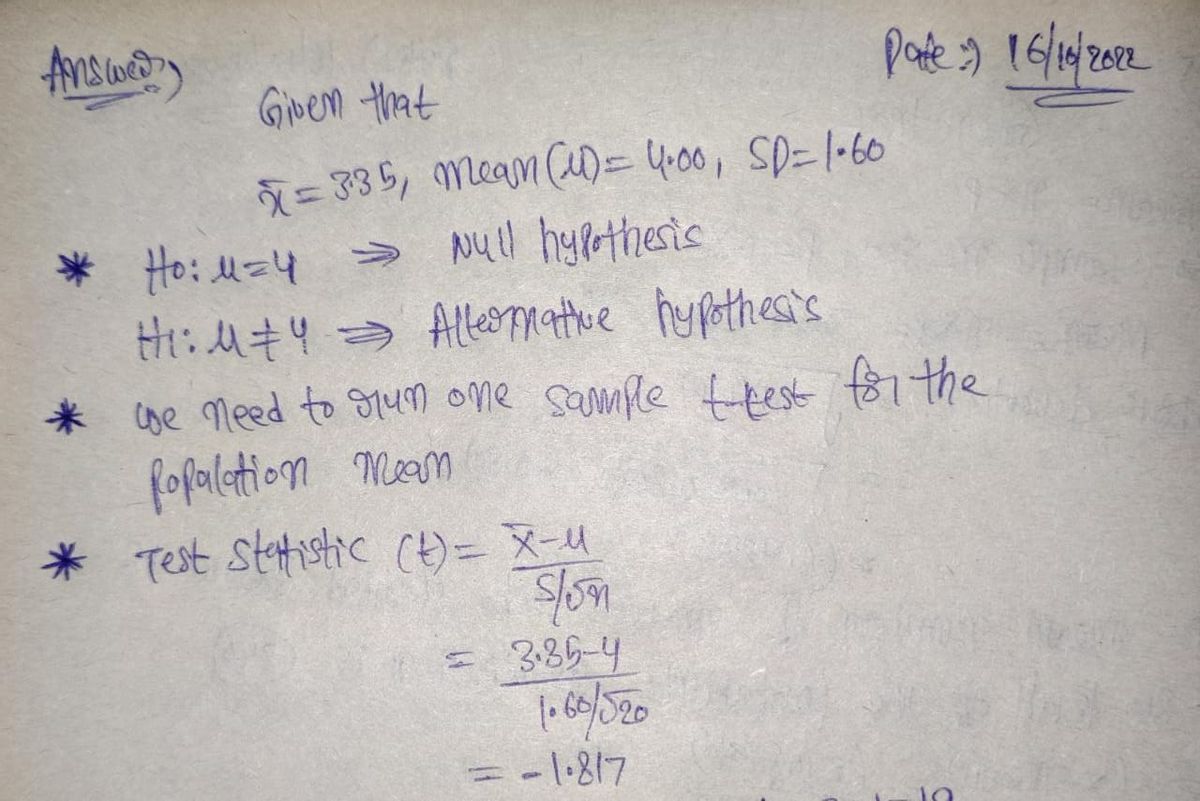
- Report our null and alternative hypotheses in words.
- Given the information we have, what specific t-test do we need to run in order to examine our hypothesis?
Provided are the ratings from the students that we recruited (see left), the mean and standard deviation for that sample (see below), and the population average (see below):
xbar =3.35, Meu=4.00 and SD=1.60
- Calculate the appropriate statistic to address our hypothesis (remember to report the formula for the statistic you use):
- Is this a one- or two-tailed test? Given that we are setting α = .05, what is the critical value for the statistical test we are conducting given our data set and hypothesis? If we need to calculate degrees of freedom to identify the critical value, be sure to report the formula and the value you calculate:
- In words, interpret what the significance testing tells us about how our sample compares to the population on our variable of interest (describe the variable). Also, report the results in APA format:
Expert Solution
Step 1

Step by step
Solved in 2 steps with 2 images

Recommended textbooks for you
MATLAB: An Introduction with Applications
Statistics
ISBN:
9781119256830
Author:
Amos Gilat
Publisher:
John Wiley & Sons Inc

Probability and Statistics for Engineering and th…
Statistics
ISBN:
9781305251809
Author:
Jay L. Devore
Publisher:
Cengage Learning

Statistics for The Behavioral Sciences (MindTap C…
Statistics
ISBN:
9781305504912
Author:
Frederick J Gravetter, Larry B. Wallnau
Publisher:
Cengage Learning
MATLAB: An Introduction with Applications
Statistics
ISBN:
9781119256830
Author:
Amos Gilat
Publisher:
John Wiley & Sons Inc
Probability and Statistics for Engineering and th…
Statistics
ISBN:
9781305251809
Author:
Jay L. Devore
Publisher:
Cengage Learning
Statistics for The Behavioral Sciences (MindTap C…
Statistics
ISBN:
9781305504912
Author:
Frederick J Gravetter, Larry B. Wallnau
Publisher:
Cengage Learning

Elementary Statistics: Picturing the World (7th E…
Statistics
ISBN:
9780134683416
Author:
Ron Larson, Betsy Farber
Publisher:
PEARSON

The Basic Practice of Statistics
Statistics
ISBN:
9781319042578
Author:
David S. Moore, William I. Notz, Michael A. Fligner
Publisher:
W. H. Freeman

Introduction to the Practice of Statistics
Statistics
ISBN:
9781319013387
Author:
David S. Moore, George P. McCabe, Bruce A. Craig
Publisher:
W. H. Freeman