Visualizing Statistical Precision Each graph below shows a scatter plot of an outcome (y or w) over x. The red circles represent the sample means of the two groups. Both graphs have 50 observations in the 0-group and 50 observations in the 1-group and the axes on both graphs are identical. The difference between group averages is also the same (group-1 average is 37 higher than group-0). Below are the results of t-tests for the difference in means for each outcome. The results are in no particular order. Results 1 group-1 mean group-0 mean difference standard error t-stat p-value 182 145 37 5.7 6.49 <0.001 Results 2 group-1 mean group-0 mean difference standard error t-stat p-value 182 145 37 12.1 3.06 0.003 Which results correspond to the difference in means for outcome y? a. Results 1 b. Results 2 c. Not enough information to determine
Visualizing Statistical Precision
Each graph below shows a
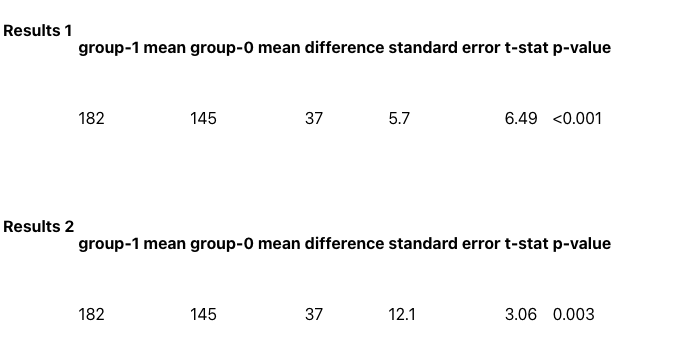
Below are the results of t-tests for the difference in means for each outcome. The results are in no particular order.
|
Results 1
|
group-1 |
group-0 mean |
difference |
standard error |
t-stat |
p-value |
|
|
182 |
145 |
37 |
5.7 |
6.49 |
<0.001 |
|
|
|
|
|
|
|
|
|
Results 2
|
group-1 mean |
group-0 mean |
difference |
standard error |
t-stat |
p-value |
|
|
182 |
145 |
37 |
12.1 |
3.06 |
0.003 |
Which results correspond to the difference in means for outcome y?

Given:

Trending now
This is a popular solution!
Step by step
Solved in 2 steps with 1 images


