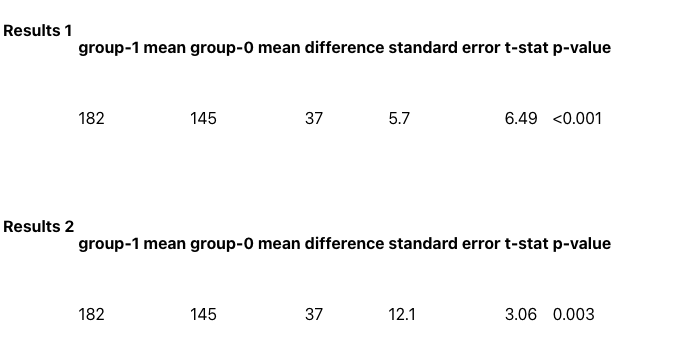
Visualizing Statistical Precision Each graph below shows a scatter plot of an outcome (y or w) over x. The red circles represent the sample means of the two groups. Both graphs have 50 observations in the 0-group and 50 observations in the 1-group and the axes on both graphs are identical. The difference between group averages is also the same (group-1 average is 37 higher than group-0). Below are the results of t-tests for the difference in means for each outcome. The results are in no particular order. Results 1 group-1 mean group-0 mean difference standard error t-stat p-value 182 145 37 5.7 6.49 <0.001 Results 2 group-1 mean group-0 mean difference standard error t-stat p-value 182 145 37 12.1 3.06 0.003 Which results correspond to the difference in means for outcome y? a. Results 1 b. Results 2 c. Not enough information to determine
Visualizing Statistical Precision
Each graph below shows a
Below are the results of t-tests for the difference in means for each outcome. The results are in no particular order.
Results 1
|
group-1 |
group-0 mean |
difference |
standard error |
t-stat |
p-value |
|
182 |
145 |
37 |
5.7 |
6.49 |
<0.001 |
|
|
|
|
|
|
|
Results 2
|
group-1 mean |
group-0 mean |
difference |
standard error |
t-stat |
p-value |
|
182 |
145 |
37 |
12.1 |
3.06 |
0.003 |
Which results correspond to the difference in means for outcome y?
![X
Below are the results of t-tests for the difference in means for each outcome. The results are in no
particular order.
Results 1
group-1 group-0
standard
difference
t-stat
p-value
mean
mean
error
182
145
37
5.7
6.49
<0.001
Results 2
group-1 group-0
standard
difference
t-stat
p-value
mean
mean
error
182
145
37
12.1
3.06
0.003
150 200 250 300 350
001 09
300 350](/v2/_next/image?url=https%3A%2F%2Fcontent.bartleby.com%2Fqna-images%2Fquestion%2F5be46675-3787-4266-a5f1-73153db994e8%2Febf80779-80e3-40fe-8284-5e600c61a8c5%2F614l795_processed.png&w=3840&q=75)
![](/static/compass_v2/shared-icons/check-mark.png)
Given:
Trending now
This is a popular solution!
Step by step
Solved in 2 steps with 1 images
![Blurred answer](/static/compass_v2/solution-images/blurred-answer.jpg)
![MATLAB: An Introduction with Applications](https://www.bartleby.com/isbn_cover_images/9781119256830/9781119256830_smallCoverImage.gif)
![Probability and Statistics for Engineering and th…](https://www.bartleby.com/isbn_cover_images/9781305251809/9781305251809_smallCoverImage.gif)
![Statistics for The Behavioral Sciences (MindTap C…](https://www.bartleby.com/isbn_cover_images/9781305504912/9781305504912_smallCoverImage.gif)
![Elementary Statistics: Picturing the World (7th E…](https://www.bartleby.com/isbn_cover_images/9780134683416/9780134683416_smallCoverImage.gif)
![The Basic Practice of Statistics](https://www.bartleby.com/isbn_cover_images/9781319042578/9781319042578_smallCoverImage.gif)
![Introduction to the Practice of Statistics](https://www.bartleby.com/isbn_cover_images/9781319013387/9781319013387_smallCoverImage.gif)