For Table 4, determine the following point estimates: 7. The mathematical expectation. 8. the variance. 9. the root mean square deviation 10. the correlation coefficient between X and Y. Table 4 is in the attached image. Thank you
For Table 4, determine the following point estimates:
7. The mathematical expectation.
8. the variance.
9. the root
10. the
Table 4 is in the attached image.
Thank you


Step by step
Solved in 3 steps with 1 images

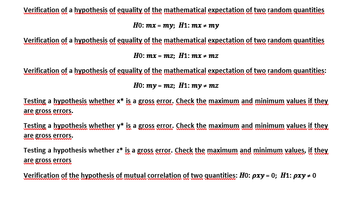
Thank you, that was really helpful. Could you please verify the few hypotheses below


Following the values above could you please:
5. Test a hypothesis that the mathematical expectation is equal to a given constant:
?0: ?? = 77; ?1: ?? ≠ 77
6. Testing a hypothesis that the mathematical expectation is equal to a given constant
?0: ?? = 64; ?1: ?? ≠ 64
7.Test a hypothesis that the mathematical expectation is equal to a given constant
?0: ?? = 128; ?1: ?? ≠ 128
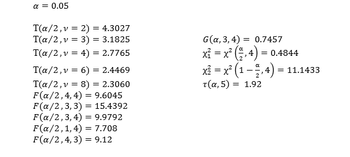
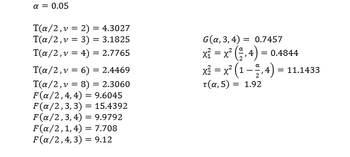
The table values are in the image below


