Researchers were interested in how much time balance (i.e., the degree to which you have enough time to do what you like) is related to happiness. They asked 12 adults to answer two questions (on 1 – 8 scales): (a) in a typical week, how much of your time are you able to spend doing the kinds of things that you enjoy (with higher scores indicating more time balance) and (b) taking all things together, how happy would you say you are (with higher scores indicating more happiness)? The research hypothesis is that there is an association between time balance and happiness. Use the Table of Descriptive statistics, correlation (r), the standard error of the correlation (SEr), and the r to zr Table, to go through the steps to compute the 95% CI. Report all values (excluding critical values) to TWO decimal places. Report critical values to THREE decimal places. Compute the following: Report all values to TWO decimal places. The Pearson Correlation = Answer Standard Error (SEr) = Answer tobs = Answer #1 Transform r to zr: In our Table, we find that r = Answer corresponds to zr = Answer #2 Compute the standard error of zr SEzr = Answer #3 Because this is the 95% confidence interval zCritical = ± Answer
Researchers were interested in how much time balance (i.e., the degree to which you have enough time to do what you like) is related to happiness. They asked 12 adults to answer two questions (on 1 – 8 scales): (a) in a typical week, how much of your time are you able to spend doing the kinds of things that you enjoy (with higher scores indicating more time balance) and (b) taking all things together, how happy would you say you are (with higher scores indicating more happiness)?
The research hypothesis is that there is an association between time balance and happiness.
Use the Table of
Report critical values to THREE decimal places.
Compute the following:
The Pearson Correlation = Answer
Standard Error (SEr) = Answer
tobs = Answer
#1 Transform r to zr:
#2 Compute the standard error of zr
SEzr = Answer
Answer ± Answer(Answer)= (Answer , Answer)
#5 Transform the confidence limits around zr to confidence limits around r
Use the data and the regression equation above to determine the SSresiduals
Ps | Time (X) | Happy (Y) | Y-predicted | Residual | Sq. Residual |
---|---|---|---|---|---|
1 | 2 | 2 | Answer | Answer | Answer |
2 | 2 | 4 | Answer | Answer | Answer |
3 | 4 | 3 | Answer | Answer | Answer |
4 | 5 | 6 | Answer | Answer | Answer |
5 | 7 | 5 | Answer | Answer | Answer |
6 | 8 | 6 | Answer | Answer | Answer |
7 | 1 | 1 | Answer | Answer | Answer |
8 | 1 | 3 | Answer | Answer | Answer |
9 | 3 | 2 | Answer | Answer | Answer |
10 | 4 | 5 | Answer | Answer | Answer |
11 | 6 | 4 | Answer | Answer | Answer |
12 | 5 | 7 | Answer | Answer | Answer |
∑ = Answer | ∑ = Answer | ∑ = Answer | ∑ = Answer |
Use the SSresidual to determine the standard error of the estimate:
Est. SE = Answer
please answer everything that says answer. i did the first chart but im confused on the rest
![Use all your calculations to complete this Table of descriptive statistics (you will use this
table to compute the correlation, SEr and t-test):
Statistic
Value
34
SP
SSX
SSY
In
df
Compute the following:
The Pearson Correlation
Standard Error (SEr) =
58
tobs =
38
Report all values to TWO decimal places.
12
10](/v2/_next/image?url=https%3A%2F%2Fcontent.bartleby.com%2Fqna-images%2Fquestion%2F57ce3033-b78f-4d66-b1b5-8248b3eac252%2Fb65e2990-83ac-4991-8523-3de33aed5f80%2F3pisub_processed.png&w=3840&q=75)
![of
Report all means to TWO decimal places.
|Happy
(Y)
2
Ps Time (X)
1 2
22
3 4
4 5
5 7
6 8
7 1
8 1
9 3
104
116
125
Mx =
4
+
6
5
CO
3
My =
4
(X-Mx) (Y - My) (X - Mx)² (Y - My)²
-2
-2
1
3
4
-3
-3
-1
0
2
1
Σ =
O
-2
O
2
1
2
co
-1
-2
1
O
3
[:
=
0
4
4
O
1
16
9
1
1
Σ =
58
4
+
CO
1
4
9
Σ=
38
(X - MX)(Y-
My)
W
O
2
8
3
O
O
3
Σ =
34](/v2/_next/image?url=https%3A%2F%2Fcontent.bartleby.com%2Fqna-images%2Fquestion%2F57ce3033-b78f-4d66-b1b5-8248b3eac252%2Fb65e2990-83ac-4991-8523-3de33aed5f80%2Fma0q2pu_processed.png&w=3840&q=75)
![](/static/compass_v2/shared-icons/check-mark.png)
Trending now
This is a popular solution!
Step by step
Solved in 5 steps
![Blurred answer](/static/compass_v2/solution-images/blurred-answer.jpg)
can you explain the 95% interval. whenever i input those anwers from the follow up its incorrect
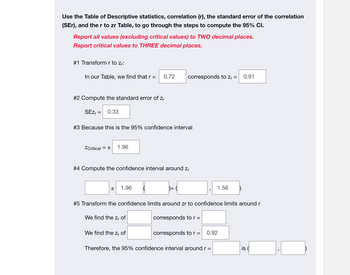
![Use the Table of Descriptive statistics, correlation (r), the standard error of the correlation
(SEr), and the r to zr Table, to go through the steps to compute the 95% CI.
Report all values (excluding critical values) to TWO decimal places.
Report critical values to THREE decimal places.
#1 Transform r to zr:
In our Table, we find that r = 0.72
#2 Compute the standard error of zr
SEZ₁ = 0.33
#3 Because this is the 95% confidence interval
ZCritical = ± 1.96
#4 Compute the confidence interval around Zr
±
1.96
corresponds to Z₁ = 0.91
We find the zr of
#5 Transform the confidence limits around zr to confidence limits around r
We find the zr of
corresponds to r =
corresponds to r =
1.56
0.92
Therefore, the 95% confidence interval around r =
is](https://content.bartleby.com/qna-images/question/57ce3033-b78f-4d66-b1b5-8248b3eac252/9ee4de81-b917-4ca0-a618-f7bbb500554a/gbp8mc2_thumbnail.png)
Answer ± Answer(Answer)= (Answer , Answer)
#5 Transform the confidence limits around zr to confidence limits around r
Use the table of
Report all values to TWO decimal places.
Y-predicted = AnswerX + Answer
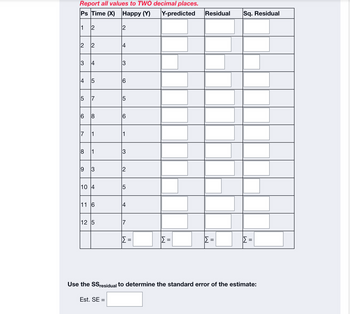
![Report all values to TWO decimal places.
Ps Time (X) Happy (Y)
Y-predicted
1 2
4 5
LO
2
6 8
∞
9 3
10 4
11 6
12 5
2
Est. SE =
CO
6
CO
LO
7
M
II
M
||
Residual
||
Sq. Residual
II
Use the SS residual to determine the standard error of the estimate:](https://content.bartleby.com/qna-images/question/57ce3033-b78f-4d66-b1b5-8248b3eac252/48640a21-1f9d-4363-bdd5-f163c2a2165f/hsq1aqh_thumbnail.png)
![MATLAB: An Introduction with Applications](https://www.bartleby.com/isbn_cover_images/9781119256830/9781119256830_smallCoverImage.gif)
![Probability and Statistics for Engineering and th…](https://www.bartleby.com/isbn_cover_images/9781305251809/9781305251809_smallCoverImage.gif)
![Statistics for The Behavioral Sciences (MindTap C…](https://www.bartleby.com/isbn_cover_images/9781305504912/9781305504912_smallCoverImage.gif)
![Elementary Statistics: Picturing the World (7th E…](https://www.bartleby.com/isbn_cover_images/9780134683416/9780134683416_smallCoverImage.gif)
![The Basic Practice of Statistics](https://www.bartleby.com/isbn_cover_images/9781319042578/9781319042578_smallCoverImage.gif)
![Introduction to the Practice of Statistics](https://www.bartleby.com/isbn_cover_images/9781319013387/9781319013387_smallCoverImage.gif)