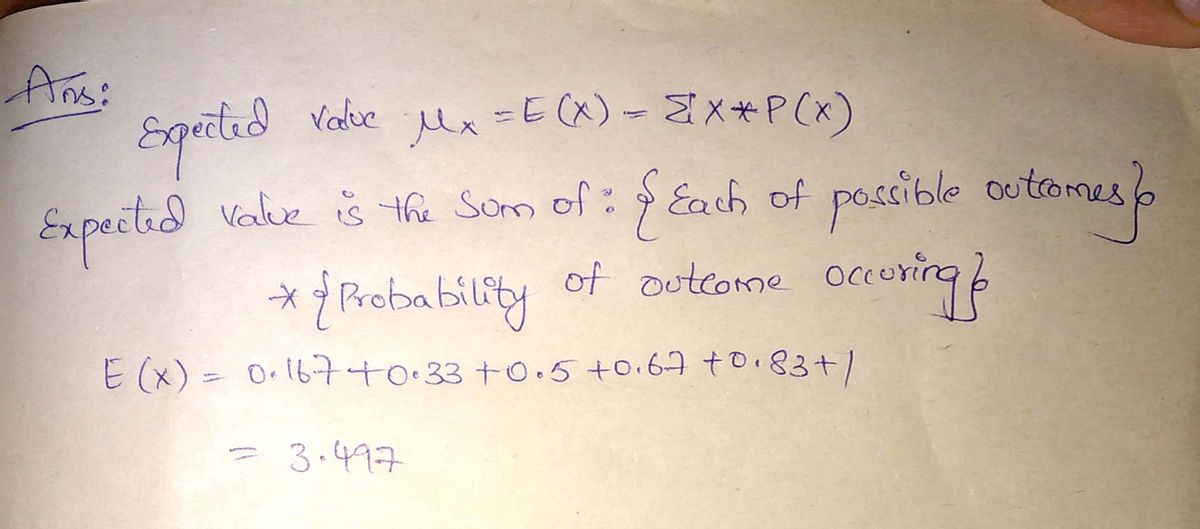
Use the table above to calculate the expected value.

MATLAB: An Introduction with Applications
6th Edition
ISBN:9781119256830
Author:Amos Gilat
Publisher:Amos Gilat
Chapter1: Starting With Matlab
Section: Chapter Questions
Problem 1P

Related questions
Question

Transcribed Image Text:Suppose you rolled a fair six-sided die a few times and recorded the results. (You would have a collection of numbers 1-6.) Now, suppose you wanted to average
these numbers. What value would you expect?
If the die was rolled 6 times and the results were: 1, 4, 2, 2, 3, 2, then the average of this sample of rolls would be 2.333. This experiment could be peformed again: 6, 5, 2,
1, 1, 4. Now, the average of this sample is 3.167. Obviously, these small samples have a lot of variation in them; however, is there a way to calculate the expected average?
If we were to construct a very large sample, rolling this die 1 million times, what would the expected value (mean) be?
Luckily, the rules of probability allows us to do this calculation without actually having to roll the die 1 million times! Below, you will find a probability table where all of the
possible outcomes from the die are listed. The first column contains the possible outcomes on the die, the second column contains the probability of each outcome (since
the die is fair, all outcomes are equally likely), the remaining columns are values used to calculate the expected value and variance.
Values Probability
ХP(x)
(x - ) - P(x)
(x)
P(x)
1
- = 0.16 1×0.16= 0.15=0.167(1-3.5)².
1.042
1
1
= 0.16
2 x 0.16 = 0.3=0.33 (2 - 3.5)2.
=0.375
6.
0.16
3x0.16 = 0.5
(3– 3.5)2.
=0.042
= 0.16
4x 0.16 = 0.6= 0.67 (4- 3.5)2.
4
20.042
=0.16
20.375
5x 0.16 =0.16 0.83 (5- 3.5)2.
(6 – 3.5)2 - ()
=0.16
6x 0.16 = 1
=1.042
Expected Value (Mean): Ux=???
Variance: o2 = E (x;- ²· P(x;)=2.918 (Sum of 4th column)
i=1
6
2(x;- H)<. P(x;) - /2.918 1.708 (Square root of the variance)
j =1
Standard Deviation:
%3D
Use the table above to calculate the expected value.
비6 16
CO
Expert Solution
Step 1

Step by step
Solved in 2 steps with 1 images

Recommended textbooks for you
MATLAB: An Introduction with Applications
Statistics
ISBN:
9781119256830
Author:
Amos Gilat
Publisher:
John Wiley & Sons Inc

Probability and Statistics for Engineering and th…
Statistics
ISBN:
9781305251809
Author:
Jay L. Devore
Publisher:
Cengage Learning

Statistics for The Behavioral Sciences (MindTap C…
Statistics
ISBN:
9781305504912
Author:
Frederick J Gravetter, Larry B. Wallnau
Publisher:
Cengage Learning
MATLAB: An Introduction with Applications
Statistics
ISBN:
9781119256830
Author:
Amos Gilat
Publisher:
John Wiley & Sons Inc
Probability and Statistics for Engineering and th…
Statistics
ISBN:
9781305251809
Author:
Jay L. Devore
Publisher:
Cengage Learning
Statistics for The Behavioral Sciences (MindTap C…
Statistics
ISBN:
9781305504912
Author:
Frederick J Gravetter, Larry B. Wallnau
Publisher:
Cengage Learning

Elementary Statistics: Picturing the World (7th E…
Statistics
ISBN:
9780134683416
Author:
Ron Larson, Betsy Farber
Publisher:
PEARSON

The Basic Practice of Statistics
Statistics
ISBN:
9781319042578
Author:
David S. Moore, William I. Notz, Michael A. Fligner
Publisher:
W. H. Freeman

Introduction to the Practice of Statistics
Statistics
ISBN:
9781319013387
Author:
David S. Moore, George P. McCabe, Bruce A. Craig
Publisher:
W. H. Freeman