Use the sample data and confidence level given below to complete parts (a) through (d). A research institute poll asked respondents if they felt vulnerable to identity theft. In the poll, n=961 and x = 600 who said "yes." Use a 99% confidence level. Click the icon to view a table of z scores. a) Find the best point estimate of the population proportion p. (Round to three decimal places as needed.) b) Identify the value of the margin of error E. E= (Round to three decimal places as needed.) c) Construct the confidence interval. ☐
Use the sample data and confidence level given below to complete parts (a) through (d). A research institute poll asked respondents if they felt vulnerable to identity theft. In the poll, n=961 and x = 600 who said "yes." Use a 99% confidence level. Click the icon to view a table of z scores. a) Find the best point estimate of the population proportion p. (Round to three decimal places as needed.) b) Identify the value of the margin of error E. E= (Round to three decimal places as needed.) c) Construct the confidence interval. ☐

Big Ideas Math A Bridge To Success Algebra 1: Student Edition 2015
1st Edition
ISBN:9781680331141
Author:HOUGHTON MIFFLIN HARCOURT
Publisher:HOUGHTON MIFFLIN HARCOURT
Chapter11: Data Analysis And Displays
Section: Chapter Questions
Problem 4CR

Related questions
Question

Transcribed Image Text:below
y felt v
proport
confide
e of the
en the
from t
e propo
Standard Normal (z) Distribution
Z
0.0
0.1
0.2
0.3
0.4
0.5
0.6
0.7
0.8
0.9
1.0
1.1
1.2
1.3
1.4
1.5
.00
5000
5398
.5793
.6179
.6554
.6915
.7257
.7580
.7881
.8159
.8413
.8643
.8849
.9032
.9192
.9332
0
Z
Cumulative Area from the LEFT
.01
.5040
.5438
.5832
.6217
.6591
.6950
.7291
.7611
.7910
.8186
.8438
.8665
.8869
.9049
.9207
.9345
.02
.5080
.5478
.5871
.6255
.6628
.6985
.7324
.7642
.7939
.8212
.8461
.8686
.8888
.9066
.9222
.9357
.03
.5120
.5517
.5910
.6293
.6664
.7019
.7357
.7673
.7967
.8238
.8485
.8708
.8907
.9082
.9236
.9370
.04
5160
.5557
.5948
.6331
.6700
.7054
.7389
.7704
.7995
.8264
.8508
.8729
.8925
.9099
9251
.9382
.05
.5199
.5596
.5987
.6368
.6736
.7088
.7422
.7734
.8023
.8289
.8531
.8749
.8944
.9115
.9265
.9394
.06
.5239
.5636
.6026
.6406
.6772
.7123
.7454
.7764
.8051
.8315
.8554
.8770
.8962
.9131
9279
.9406
.07
.5279
.5675
.6064
.6443
.6808
.7157
.7486
.7794
.8078
.8340
.8577
.8790
.8980
.9147
.9292
.9418
.08
5319
.5714
.6103
.6480
.6844
.7190
.7517
.7823
.8106
.8365
.8599
.8810
.8997
.9162
.9306
9429
.09
5359
.5753
.6141
.6517
.6879
.7224
.7549
.7852
.8133
.8389
.8621
.8830
.9015
.9177
.9319
9441
Z
0.0
0.1
0.2
0.3
0.4
0.5
0.6
0.7
0.8
0.9
1.0
1.1
1.2
1.3
1.4
1.5
31

Transcribed Image Text:Use the sample data and confidence level given below to complete parts (a) through (d).
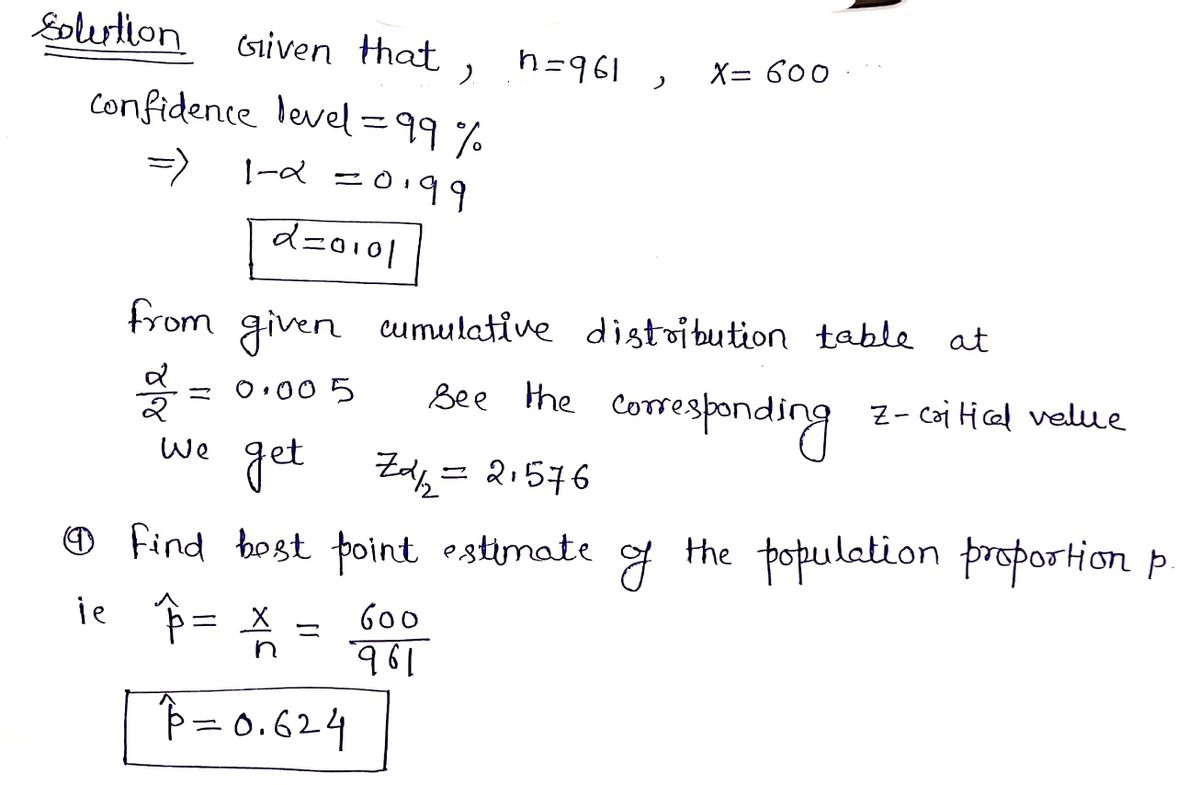
A research institute poll asked respondents if they felt vulnerable to identity theft. In the poll, n=961 and x = 600 who said "yes." Use a 99% confidence level.
Click the icon to view a table of z scores.
a) Find the best point estimate of the population proportion p.
(Round to three decimal places as needed.)
b) Identify the value of the margin of error E.
E=
(Round to three decimal places as needed.)
c) Construct the confidence interval.
<p<
(Round to three decimal places as needed.)
d) Write a statement that correctly interprets the confidence interval. Choose the correct answer below.
O A. There is a 99% chance that the true value of the population proportion will fall between the lower bound and the upper bound.
O B. 99% of sample proportions will fall between the lower bound and the upper bound.
O C. One has 99% confidence that the interval from the lower bound to the upper bound actually does contain the true value of the population proportion.
O D. One has 99% confidence that the sample proportion is equal to the population proportion.
Expert Solution
Step 1

Step by step
Solved in 3 steps with 3 images

Recommended textbooks for you
Big Ideas Math A Bridge To Success Algebra 1: Stu…
Algebra
ISBN:
9781680331141
Author:
HOUGHTON MIFFLIN HARCOURT
Publisher:
Houghton Mifflin Harcourt

Glencoe Algebra 1, Student Edition, 9780079039897…
Algebra
ISBN:
9780079039897
Author:
Carter
Publisher:
McGraw Hill

Holt Mcdougal Larson Pre-algebra: Student Edition…
Algebra
ISBN:
9780547587776
Author:
HOLT MCDOUGAL
Publisher:
HOLT MCDOUGAL
Big Ideas Math A Bridge To Success Algebra 1: Stu…
Algebra
ISBN:
9781680331141
Author:
HOUGHTON MIFFLIN HARCOURT
Publisher:
Houghton Mifflin Harcourt
Glencoe Algebra 1, Student Edition, 9780079039897…
Algebra
ISBN:
9780079039897
Author:
Carter
Publisher:
McGraw Hill
Holt Mcdougal Larson Pre-algebra: Student Edition…
Algebra
ISBN:
9780547587776
Author:
HOLT MCDOUGAL
Publisher:
HOLT MCDOUGAL
