Use Table 4 as shown in img.jpg to find the following probabilities for a standard normal random variable Z. a. P(0≤Z≤1.2) b. P(-0.9≤Z≤0) c.P(0.3≤Z≤1.56)
Use Table 4 as shown in img.jpg to find the following probabilities for a standard normal random variable Z. a. P(0≤Z≤1.2) b. P(-0.9≤Z≤0) c.P(0.3≤Z≤1.56)

MATLAB: An Introduction with Applications
6th Edition
ISBN:9781119256830
Author:Amos Gilat
Publisher:Amos Gilat
Chapter1: Starting With Matlab
Section: Chapter Questions
Problem 1P

Related questions
Question
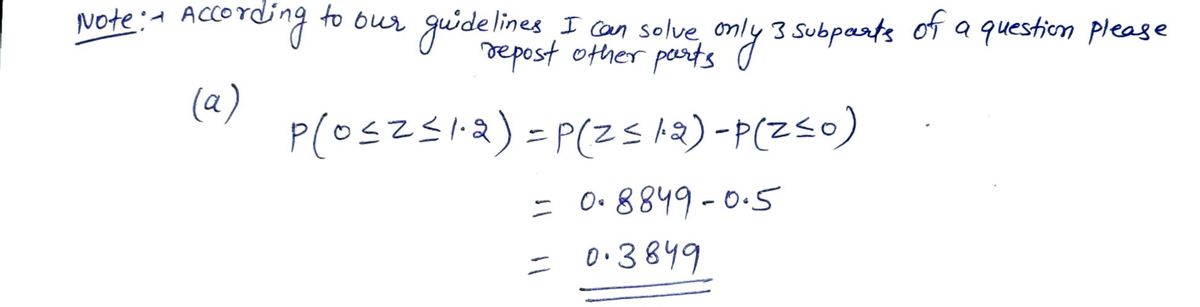
Use Table 4 as shown in img.jpg to find the following probabilities for a standard normal random variable Z.
a. P(0≤Z≤1.2)
b. P(-0.9≤Z≤0)
c.P(0.3≤Z≤1.56)
d. P(-0.2≤Z≤0.2)
e. P(-200≤Z≤-1.56)

Transcribed Image Text:**Table 4: Critical Values of t**
This table provides the critical values of the t-distribution for various degrees of freedom (df) and significance levels (\(\alpha\)). These values are used in statistical hypothesis testing, particularly in t-tests.
**Diagram:**
Above the table is a normal distribution curve with a shaded tail representing the area \(\alpha\) (significance level). The critical value \( t_{\alpha} \) is marked on the horizontal axis, beyond which the area \(\alpha\) lies under the curve.
**Table Columns:**
- **Degrees of Freedom:** Ranges from 1 to 29.
- Critical values are provided for significance levels \(\alpha\) = 0.100, 0.050, 0.025, 0.010, and 0.005.
**Critical Values Chart:**
| Degrees of Freedom | \( t_{0.100} \) | \( t_{0.050} \) | \( t_{0.025} \) | \( t_{0.010} \) | \( t_{0.005} \) |
|--------------------|----------------|----------------|----------------|----------------|---------------|
| 1 | 3.078 | 6.314 | 12.706 | 31.821 | 63.657 |
| 2 | 1.886 | 2.920 | 4.303 | 6.965 | 9.925 |
| 3 | 1.638 | 2.353 | 3.182 | 4.541 | 5.841 |
| 4 | 1.533 | 2.132 | 2.776 | 3.747 | 4.604 |
| 5 | 1.476 | 2.015 | 2.571 | 3.365 | 4.032 |
| 6 | 1.440 | 1.943 | 2.447 | 3.143 | 3.707 |
| 7 | 1.415 | 1.895 | 2.365 | 2.998 | 3.499 |
| 8 | 1.
Expert Solution
Step 1

Step by step
Solved in 2 steps with 2 images

Similar questions
Recommended textbooks for you
MATLAB: An Introduction with Applications
Statistics
ISBN:
9781119256830
Author:
Amos Gilat
Publisher:
John Wiley & Sons Inc

Probability and Statistics for Engineering and th…
Statistics
ISBN:
9781305251809
Author:
Jay L. Devore
Publisher:
Cengage Learning

Statistics for The Behavioral Sciences (MindTap C…
Statistics
ISBN:
9781305504912
Author:
Frederick J Gravetter, Larry B. Wallnau
Publisher:
Cengage Learning
MATLAB: An Introduction with Applications
Statistics
ISBN:
9781119256830
Author:
Amos Gilat
Publisher:
John Wiley & Sons Inc
Probability and Statistics for Engineering and th…
Statistics
ISBN:
9781305251809
Author:
Jay L. Devore
Publisher:
Cengage Learning
Statistics for The Behavioral Sciences (MindTap C…
Statistics
ISBN:
9781305504912
Author:
Frederick J Gravetter, Larry B. Wallnau
Publisher:
Cengage Learning

Elementary Statistics: Picturing the World (7th E…
Statistics
ISBN:
9780134683416
Author:
Ron Larson, Betsy Farber
Publisher:
PEARSON

The Basic Practice of Statistics
Statistics
ISBN:
9781319042578
Author:
David S. Moore, William I. Notz, Michael A. Fligner
Publisher:
W. H. Freeman

Introduction to the Practice of Statistics
Statistics
ISBN:
9781319013387
Author:
David S. Moore, George P. McCabe, Bruce A. Craig
Publisher:
W. H. Freeman