Use a calculator. n the first field on the left, type: v =[0, 2.6, 3, 3.7, 4.5, 4.5, 5.9, 6.3, 6.5, 7, 8] What is the IQR? Q3-Q1 from the box plot. Type: boxplot(v, 2) into the second field. Adjust height to 3.  Find the Q3 and Q1.  Find IQR.

MATLAB: An Introduction with Applications
6th Edition
ISBN:9781119256830
Author:Amos Gilat
Publisher:Amos Gilat
Chapter1: Starting With Matlab
Section: Chapter Questions
Problem 1P
icon
Related questions
Question
100%
Practice Pack

Use a calculator.

n the first field on the left, type: v =[0, 2.6, 3, 3.7, 4.5, 4.5, 5.9, 6.3, 6.5, 7, 8]

What is the IQR? Q3-Q1 from the box plot.

Type: boxplot(v, 2) into the second field.

Adjust height to 3.  Find the Q3 and Q1.  Find IQR.

Expert Solution
Step 1

Since it is not mention which calculater to use I will solve the first part for you manually. 

The boxplot displays the five - summary of data. The five - number summary is the minimum value, 1st Quartile ( Q1) , Median, 3rd Quartile and the maximum value. 

Data :  v =[0, 2.6, 3, 3.7, 4.5, 4.5, 5.9, 6.3, 6.5, 7, 8]

The 5- summary statistics:

Minimum value = 0

Maximum value = 8

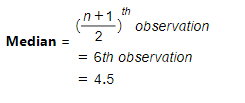
To find Median below are the steps - 

  1.  Arrange the data in ascending order ( from lowest to the highest value ). We can see that data is already aranged in ascending order.
  2. Count the total number of observation. The total number of observations are 11 there is odd number of terms, the median is the center term or it can found using formula.

Statistics homework question answer, step 1, image 1

Q1 : The median is 4.5 consider all the data values which are below the 4.5 which are [0,2.6,3,3.7, 4.5]. These observations will be called the "first half of data". In the first half there are 5 observations which is again odd. Therefore the median of the first half of data is as given by.

Statistics homework question answer, step 1, image 2

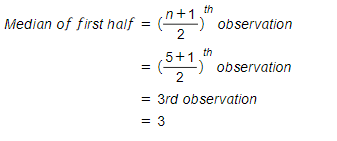
Therefore the first quartile (Q1) = 3

Q3: Similarly we can find the Q3 but now we have to consider the data which are above the 4.5 which are [5.9,6.3,6.5,7,8]. These observations will be called the "second half of data". In the second half there ae 5 observations which is odd. Therefore , the median of the second half of data is given by.

Median of second half = (n+12)th observation= (5+12)thobservation = 3rd observation= 6.5

Therefore the first quartile (Q3) = 6.5


Better your learning with
Practice Pack
trending now

Trending now

This is a popular solution!

video

Learn your way

Includes step-by-step video

steps

Step by step

Solved in 2 steps with 3 images

Blurred answer
Knowledge Booster
Basics (types, similarity, etc)
Learn more about
Need a deep-dive on the concept behind this application? Look no further. Learn more about this topic, statistics and related others by exploring similar questions and additional content below.
Similar questions
  • SEE MORE QUESTIONS
Recommended textbooks for you
MATLAB: An Introduction with Applications
Statistics
ISBN:
9781119256830
Author:
Amos Gilat
Publisher:
John Wiley & Sons Inc
Probability and Statistics for Engineering and th…
Statistics
ISBN:
9781305251809
Author:
Jay L. Devore
Publisher:
Cengage Learning
Statistics for The Behavioral Sciences (MindTap C…
Statistics
ISBN:
9781305504912
Author:
Frederick J Gravetter, Larry B. Wallnau
Publisher:
Cengage Learning
Elementary Statistics: Picturing the World (7th E…
Statistics
ISBN:
9780134683416
Author:
Ron Larson, Betsy Farber
Publisher:
PEARSON
The Basic Practice of Statistics
Statistics
ISBN:
9781319042578
Author:
David S. Moore, William I. Notz, Michael A. Fligner
Publisher:
W. H. Freeman
Introduction to the Practice of Statistics
Statistics
ISBN:
9781319013387
Author:
David S. Moore, George P. McCabe, Bruce A. Craig
Publisher:
W. H. Freeman