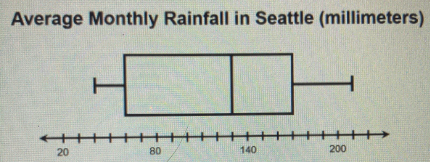
Find the range and interquartile range (IQR) for the monthly rainfall (in millime- ters) in Seattle based on the box-and-whisker plot below. Average Monthly Rainfall in Seattle (millimeters) 20 +++▬▬▬▬▬▬▬▬▬▬▬▬▬▬▬▬▬▬▬▬▬▬▬+ 140 80 200
Find the range and interquartile range (IQR) for the monthly rainfall (in millime- ters) in Seattle based on the box-and-whisker plot below. Average Monthly Rainfall in Seattle (millimeters) 20 +++▬▬▬▬▬▬▬▬▬▬▬▬▬▬▬▬▬▬▬▬▬▬▬+ 140 80 200

MATLAB: An Introduction with Applications
6th Edition
ISBN:9781119256830
Author:Amos Gilat
Publisher:Amos Gilat
Chapter1: Starting With Matlab
Section: Chapter Questions
Problem 1P

Related questions
Question

Transcribed Image Text:The image depicts a simple two-cell table used to represent statistical measures. The table has two rows:
1. **Range**: This is highlighted in a brown color. The number "1" in a blue circle appears beside it, possibly indicating its position or priority in a list.
2. **IQR (Interquartile Range)**: This is highlighted in a gray color. The number "2" in a blue circle appears beside it, similarly indicating its position or priority.
The table visually organizes these two statistical concepts, which are commonly used in data analysis to measure variability.

Transcribed Image Text:**Understanding Box-and-Whisker Plots**
**Instruction:** Find the range and interquartile range (IQR) for the monthly rainfall (in millimeters) in Seattle, based on the box-and-whisker plot below.
**Diagram: Average Monthly Rainfall in Seattle (millimeters)**
- The box-and-whisker plot displays the distribution of monthly rainfall in Seattle.
- The horizontal axis measures rainfall in millimeters, ranging from 20 to 200.
- The plot includes a box and two "whiskers" extending from either side.
- The left whisker starts at approximately 30 mm, and the right whisker ends around 190 mm.
- The left edge of the box (1st quartile) is at about 70 mm, and the right edge (3rd quartile) is at around 150 mm.
- The line within the box represents the median, which is approximately 120 mm.
**Tasks:**
- **Press each hotspot.**
- **Label the corresponding number below with the requested value.**
This plot helps highlight the spread and central tendency of the rainfall data, allowing for an easy visual interpretation of variability within the dataset.
Expert Solution
Step 1: Information given is
The box and whisker plot is

Trending now
This is a popular solution!

Step by step
Solved in 3 steps with 1 images

Recommended textbooks for you
MATLAB: An Introduction with Applications
Statistics
ISBN:
9781119256830
Author:
Amos Gilat
Publisher:
John Wiley & Sons Inc

Probability and Statistics for Engineering and th…
Statistics
ISBN:
9781305251809
Author:
Jay L. Devore
Publisher:
Cengage Learning

Statistics for The Behavioral Sciences (MindTap C…
Statistics
ISBN:
9781305504912
Author:
Frederick J Gravetter, Larry B. Wallnau
Publisher:
Cengage Learning
MATLAB: An Introduction with Applications
Statistics
ISBN:
9781119256830
Author:
Amos Gilat
Publisher:
John Wiley & Sons Inc
Probability and Statistics for Engineering and th…
Statistics
ISBN:
9781305251809
Author:
Jay L. Devore
Publisher:
Cengage Learning
Statistics for The Behavioral Sciences (MindTap C…
Statistics
ISBN:
9781305504912
Author:
Frederick J Gravetter, Larry B. Wallnau
Publisher:
Cengage Learning

Elementary Statistics: Picturing the World (7th E…
Statistics
ISBN:
9780134683416
Author:
Ron Larson, Betsy Farber
Publisher:
PEARSON

The Basic Practice of Statistics
Statistics
ISBN:
9781319042578
Author:
David S. Moore, William I. Notz, Michael A. Fligner
Publisher:
W. H. Freeman

Introduction to the Practice of Statistics
Statistics
ISBN:
9781319013387
Author:
David S. Moore, George P. McCabe, Bruce A. Craig
Publisher:
W. H. Freeman