To assess how women are doing in the workforce, we have gathered data from 120 firms with 100 to 500 employees, and have recorded how many of the top 25 highest paid employees are female. Use the data provided in the image. Q1 What is the overall proportion of females in the top 25? Answer is .5093 Q2 What is the lower bound of the 95% confidence interval for the mean proportion of females in the top 25? Answers are not: .4895 or .4634 or .0541 or .0550 or .0542 Q3 What is the upper bound of the 95% confidence interval for the mean proportion of females in the top 25? Answers are not: .0020 or .6794 or .0597 or .0587 or .0746 or .0983
To assess how women are doing in the workforce, we have gathered data from 120 firms with 100 to 500 employees, and have recorded how many of the top 25 highest paid employees are female. Use the data provided in the image.
Q1 What is the overall proportion of females in the top 25? Answer is .5093
Q2 What is the lower bound of the 95% confidence interval for the
Answers are not: .4895 or .4634 or .0541 or .0550 or .0542
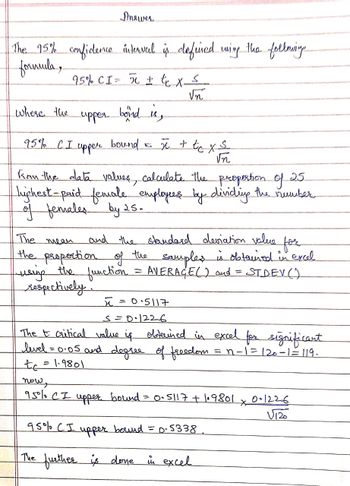
Q3 What is the upper bound of the 95% confidence interval for the mean proportion of females in the top 25?
Answers are not: .0020 or .6794 or .0597 or .0587 or .0746 or .0983
![Firm
1
2
3
4
5
6
7
8
9
10
11
12
13
14
15
16
17
18
19
20
21
22
23
24
25
26
27
28
29
30
31
32
33
34
35
36
37
38
39
40
41
42
43
44
45
46
47
48
49
50
51
52
53
54
55
56
57
58
59
60
61
62
63
64
65
66
67
68
69
70
71
72
73
74
75
76
77
78
79
80
81
82
83
84
85
86
87
88
89
90
91
92
93
94
95
96
97
98
99
100
101
102
103
104
105
106
107
108
109
110
111
112
113
114
115
116
117
118
119
120
Total # of Employees
170
355
233
191
191
374
318
291
106
201
106
111
355
343
160
174
169
339
288
235
236
389
128
155
242
361
226
118
301
159
113
142
360
106
199
355
211
468
204
321
355
111
146
250
249
145
160
150
176
230
192
179
302
150
105
158
143
134
106
174
224
108
175
463
161
376
270
111
212
162
119
255
155
373
287
207
167
124
212
217
393
261
222
301
242
242
222
195
213
248
305
380
275
149
154
213
212
108
122
153
179
274
260
150
260
303
184
246
303
171
420
284
210
324
244
206
113
104
139
357
# of Female in top 25
15
10
16
12
18
11
6
16
14
12
18
15
13
11
10
15
14
16
13
12
9
13
8
10
14
10
11
12
15
7
12
16
12
6
10
14
17
14
8
11
13
10
19
17
12
11
10
16
18
18
18
7
8
11
8
16
14
20
19
16
16
19
15
12
10
4
11
19
20
10
12
9
12
14
13
7
13
7
9
13
15
13
12
12
10
12
15
10
14
4
11
11
13
12
9
13
11
12
12
10
11
18
10
22
11
11
12
15
13
12
13
10
13
12
12
11
13
15
18
12
18](/v2/_next/image?url=https%3A%2F%2Fcontent.bartleby.com%2Fqna-images%2Fquestion%2F0dcbb223-a8ba-411d-bc90-11a4ad5852a5%2F9328a5f7-8bb3-477e-8d06-060c060441c1%2Fxv5pon_processed.png&w=3840&q=75)
![](/static/compass_v2/shared-icons/check-mark.png)
Trending now
This is a popular solution!
Step by step
Solved in 4 steps with 1 images
![Blurred answer](/static/compass_v2/solution-images/blurred-answer.jpg)
Lower and upper bounds are incorrect. Here is the correct upper bound calculation and answer. Please assist with the correct lower bound answer
![The 95% confidence interval is defined wing the follmining
formula,
95% CI = 5 + t₁ x ≤
√n
upper
bond is,
95% CI upper bound = x + tcx≤
√n
where the
Answer
25
Kom the alata values, calculate the proportion of
highest-paid female employees by dividing the number
of females by 25.
The mean
and the standard deviation value
the proportion of the samples is obtained in excel
using the function = AVERACE() and = STDEV()
respectively.
=
ñ
поше
95% CI
S=0·1226
The t critical value is obtained in excel for significant
level = 0.05 and degree of freedom
= n-1=120-1=119.
to
1.9801
= 0.5117
upper bound =
95% CI upper bound = p. 5338₁
The further is done in excel
= 0·5117 +1₁9801
*
0.1226
V120](https://content.bartleby.com/qna-images/question/0dcbb223-a8ba-411d-bc90-11a4ad5852a5/7d6e83b8-dbba-4d16-ad5c-086250a7d3ca/s5r7z4_thumbnail.jpeg)
![MATLAB: An Introduction with Applications](https://www.bartleby.com/isbn_cover_images/9781119256830/9781119256830_smallCoverImage.gif)
![Probability and Statistics for Engineering and th…](https://www.bartleby.com/isbn_cover_images/9781305251809/9781305251809_smallCoverImage.gif)
![Statistics for The Behavioral Sciences (MindTap C…](https://www.bartleby.com/isbn_cover_images/9781305504912/9781305504912_smallCoverImage.gif)
![Elementary Statistics: Picturing the World (7th E…](https://www.bartleby.com/isbn_cover_images/9780134683416/9780134683416_smallCoverImage.gif)
![The Basic Practice of Statistics](https://www.bartleby.com/isbn_cover_images/9781319042578/9781319042578_smallCoverImage.gif)
![Introduction to the Practice of Statistics](https://www.bartleby.com/isbn_cover_images/9781319013387/9781319013387_smallCoverImage.gif)