The probability distribution for the number of sales done by a new Number of Sales per day x Number of days f P(x) 0 1 2 3 st 4 16 19 15 21 9 16 100 19 100 15 100 9 100 = 0.16 10 = = 0.19 21 = 0.21 100 = 0.15 = 0.09

College Algebra (MindTap Course List)
12th Edition
ISBN:9781305652231
Author:R. David Gustafson, Jeff Hughes
Publisher:R. David Gustafson, Jeff Hughes
Chapter4: Polynomial And Rational Functions
Section4.6: Rational Functions
Problem 11SC: Find the mean hourly cost when the cell phone described above is used for 240 minutes.
icon
Related questions
Question

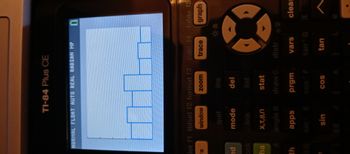
Hi, could you please help me with graphing this on a Texas TI-84 plus CE graphing calculator. I put in all my data in L1 I make sure I only have one plot on and I make sure I am choosing the histogram option. However it appears that my window settings is completely wrong because I only see 5 bars and they do not match how the picture looks.

The probability distribution for the number of sales done by a new
Number of Sales per day x
Number of days f P(x)
16
100
0
1
2
3
4
5
6
7
Total
16
19
15
21
9
10
8
2
100
19
100
15
100
21
100
9
100
10
100
8
100
2
100
1
= 0.16
=
0.19
= 0.15
= 0.21
= 0.09
= 0.10
=
0.08
= 0.02
Transcribed Image Text:The probability distribution for the number of sales done by a new Number of Sales per day x Number of days f P(x) 16 100 0 1 2 3 4 5 6 7 Total 16 19 15 21 9 10 8 2 100 19 100 15 100 21 100 9 100 10 100 8 100 2 100 1 = 0.16 = 0.19 = 0.15 = 0.21 = 0.09 = 0.10 = 0.08 = 0.02
Expert Solution
trending now

Trending now

This is a popular solution!

steps

Step by step

Solved in 2 steps with 4 images

Blurred answer
Follow-up Questions
Read through expert solutions to related follow-up questions below.
Follow-up Question

Hi,

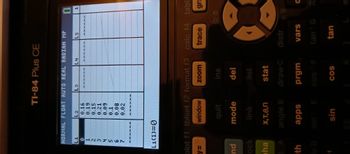
I'm sorry but I'm honestly not sure why this isn't working. I have tried this twice as you instructed. Here is a picture of the graph screen which is zoomed out, and also my data with L1 and L2 entered. The data for the window screen is the same as your calculator shows . What part am I missing? Thank you.
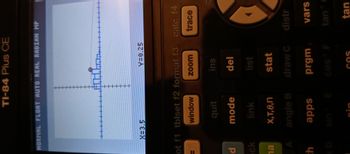
NORMAL FLOAT AUTO REAL RADIAN MP
=
d
ock
na
TI-84 Plus CE
X=3.5
ot f1 tblset f2 format f3
window
th
quit
mode
link
X,T,0,n
angle B
Th
apps
D+++++
Y=0.25
zoom
ins
del
list
stat
draw C distr
prgm
calc f4
trace
COS
vars
tan (
tan
Transcribed Image Text:NORMAL FLOAT AUTO REAL RADIAN MP = d ock na TI-84 Plus CE X=3.5 ot f1 tblset f2 format f3 window th quit mode link X,T,0,n angle B Th apps D+++++ Y=0.25 zoom ins del list stat draw C distr prgm calc f4 trace COS vars tan ( tan
L1(1)=0))
nd
NORMAL FLOAT AUTO REAL RADIAN MP
NOVIWNEOF
ock
pha
th
A
TI-84 Plus CE
0.16
0.19
0.15
0.89
0.08
0.02
plot f1 tblset f2 format f3 calc f4 table
y=
window
zoom
trace
gra
quit
mode
link
X,T,0,n
angle B
apps
sin
micolo
ins
del
list
L4
stat
draw C distr
prgm
COS
com.cod.ew.com.com
cos
m
vars
tan
0
-0 €
tan G
C
70
Transcribed Image Text:L1(1)=0)) nd NORMAL FLOAT AUTO REAL RADIAN MP NOVIWNEOF ock pha th A TI-84 Plus CE 0.16 0.19 0.15 0.89 0.08 0.02 plot f1 tblset f2 format f3 calc f4 table y= window zoom trace gra quit mode link X,T,0,n angle B apps sin micolo ins del list L4 stat draw C distr prgm COS com.cod.ew.com.com cos m vars tan 0 -0 € tan G C 70
Solution
Bartleby Expert
SEE SOLUTION
Follow-up Question

Hi,

What do I need to change so I see eight bars instead of only 7? Thank you.
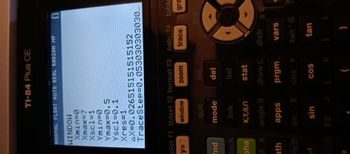
NORMAL FLOAT AUTO REAL RADIAN MP
WINDOW
2nd
1
Xmin=0
Xmax=7
Xsc1=1
Ymin=0
ath
2
plot f1 tblset f2 format f3 calc f4 table
y=
window
zoom
trace
gra
lock
TI-84 Plus CE
Ymax=0.5
Yscl=0.1
Xres=1
pha
st A
AX=0.026515151515152
TraceStep=0.053030303030...
quit
mode
link
X,T,0,n
angle B
apps
sin E
ins
del
list
stat
draw C
prgm
cos F
sin
EE J(
COS
distr
0
O
0 €
vars
tan¹ G
tan
Transcribed Image Text:NORMAL FLOAT AUTO REAL RADIAN MP WINDOW 2nd 1 Xmin=0 Xmax=7 Xsc1=1 Ymin=0 ath 2 plot f1 tblset f2 format f3 calc f4 table y= window zoom trace gra lock TI-84 Plus CE Ymax=0.5 Yscl=0.1 Xres=1 pha st A AX=0.026515151515152 TraceStep=0.053030303030... quit mode link X,T,0,n angle B apps sin E ins del list stat draw C prgm cos F sin EE J( COS distr 0 O 0 € vars tan¹ G tan
NORMAL FLOAT AUTO REAL RADIAN MP
nd
lot f1 tblset f2 format f3 calc f4 table f5
window
trace graph
ock
ha
TI-84 Plus CE
th
quit
mode
link
X,T,0,n
angle B
apps
sin
zoom
ins
del
list
stat
draw C
prgm
COS
☀ Đ
3
distr
0
vars
tan
clear
tan G π
Transcribed Image Text:NORMAL FLOAT AUTO REAL RADIAN MP nd lot f1 tblset f2 format f3 calc f4 table f5 window trace graph ock ha TI-84 Plus CE th quit mode link X,T,0,n angle B apps sin zoom ins del list stat draw C prgm COS ☀ Đ 3 distr 0 vars tan clear tan G π
Solution
Bartleby Expert
SEE SOLUTION
Recommended textbooks for you
College Algebra (MindTap Course List)
Algebra
ISBN:
9781305652231
Author:
R. David Gustafson, Jeff Hughes
Publisher:
Cengage Learning
Big Ideas Math A Bridge To Success Algebra 1: Stu…
Algebra
ISBN:
9781680331141
Author:
HOUGHTON MIFFLIN HARCOURT
Publisher:
Houghton Mifflin Harcourt
Algebra & Trigonometry with Analytic Geometry
Algebra
ISBN:
9781133382119
Author:
Swokowski
Publisher:
Cengage
College Algebra
College Algebra
Algebra
ISBN:
9781337282291
Author:
Ron Larson
Publisher:
Cengage Learning
Trigonometry (MindTap Course List)
Trigonometry
ISBN:
9781337278461
Author:
Ron Larson
Publisher:
Cengage Learning
College Algebra
College Algebra
Algebra
ISBN:
9781305115545
Author:
James Stewart, Lothar Redlin, Saleem Watson
Publisher:
Cengage Learning