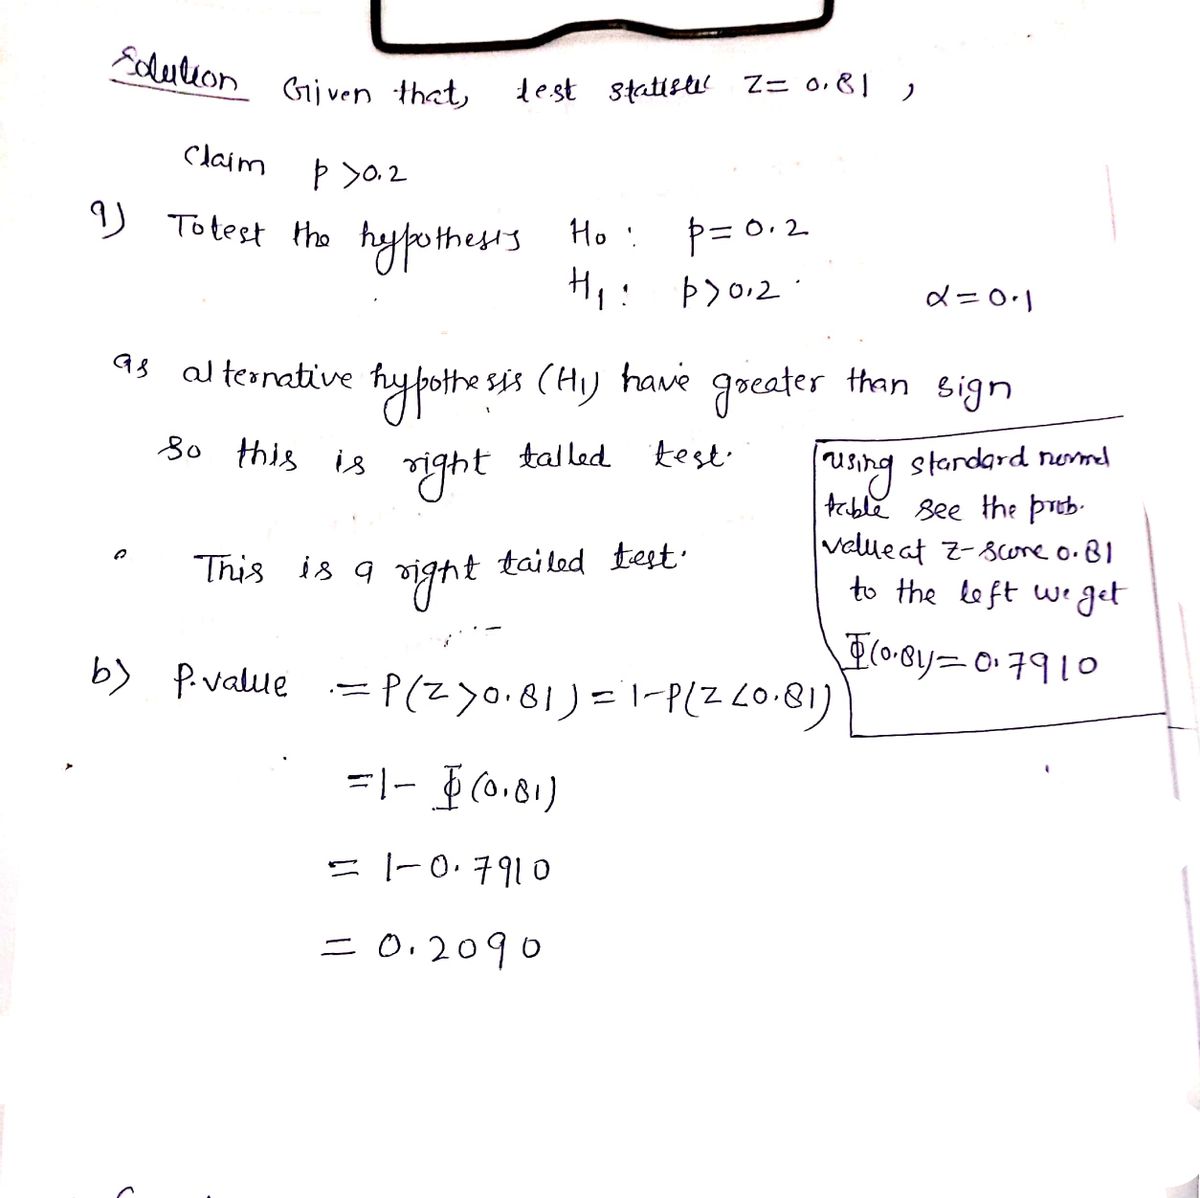
The test statistic of z=0.81 is obtained when testing the claim that p > 0.2. a. Identify the hypothesis test as being two-tailed, left-tailed, or right-tailed. b. Find the P-value. c. Using a significance level of a = 0.10, should we reject Ho or should we fail to reject Ho? Click here to view page 1 of the standard normal distribution table. Click here to view page 2 of the standard normal distribution table. a. This is a test. b. P-value = (Round to three decimal places as needed.) c. Choose the correct conclusion below. OA. Fail to reject Ho. There is not sufficient evidence to support the claim that p>0.2. B. Reject Ho. There is not sufficient evidence to support the claim that p > 0.2. C. Fail to reject Ho. There is sufficient evidence to support the claim that p > 0.2. O D. Reject Ho. There is sufficient evidence to support the claim that p > 0.2.
The test statistic of z=0.81 is obtained when testing the claim that p > 0.2. a. Identify the hypothesis test as being two-tailed, left-tailed, or right-tailed. b. Find the P-value. c. Using a significance level of a = 0.10, should we reject Ho or should we fail to reject Ho? Click here to view page 1 of the standard normal distribution table. Click here to view page 2 of the standard normal distribution table. a. This is a test. b. P-value = (Round to three decimal places as needed.) c. Choose the correct conclusion below. OA. Fail to reject Ho. There is not sufficient evidence to support the claim that p>0.2. B. Reject Ho. There is not sufficient evidence to support the claim that p > 0.2. C. Fail to reject Ho. There is sufficient evidence to support the claim that p > 0.2. O D. Reject Ho. There is sufficient evidence to support the claim that p > 0.2.

MATLAB: An Introduction with Applications
6th Edition
ISBN:9781119256830
Author:Amos Gilat
Publisher:Amos Gilat
Chapter1: Starting With Matlab
Section: Chapter Questions
Problem 1P

Related questions
Question

Transcribed Image Text:The text presented involves statistical hypothesis testing, specifically using a test statistic and p-value to determine the outcome of a test regarding a population proportion.
---
### Hypothesis Testing Overview
1. **Test Statistic:**
- The test statistic is given as \( z = 0.81 \). This measurement is used to determine how far sample data deviates from the null hypothesis.
2. **Claim:**
- The claim being tested is that the proportion \( p > 0.2 \).
3. **Hypothesis Test Type:**
- The test is to be identified regarding whether it is two-tailed, left-tailed, or right-tailed.
4. **P-value:**
- The p-value is a crucial part of determining the significance of the test statistic. It will be found and rounded to three decimal places.
5. **Decision Criteria:**
- Using a significance level of \( \alpha = 0.10 \), the decision is whether to reject or fail to reject the null hypothesis (\( H_0 \)).
6. **Standard Normal Distribution Tables:**
- Links are provided to access tables (Page 1 and Page 2) that aid in determining the p-value based on the test statistic.
7. **Conclusion Choices:**
- Four options are available to conclude the hypothesis test:
- A. Fail to reject \( H_0 \). There is not sufficient evidence to support the claim that \( p > 0.2 \).
- B. Reject \( H_0 \). There is not sufficient evidence to support the claim that \( p > 0.2 \).
- C. Fail to reject \( H_0 \). There is sufficient evidence to support the claim that \( p > 0.2 \).
- D. Reject \( H_0 \). There is sufficient evidence to support the claim that \( p > 0.2 \).
---
To choose the correct conclusion, one must calculate the p-value using the standard normal distribution table and compare it to the significance level to determine whether the evidence is strong enough to support the claim \( p > 0.2 \).
Expert Solution
Step 1

Trending now
This is a popular solution!

Step by step
Solved in 2 steps with 2 images

Recommended textbooks for you
MATLAB: An Introduction with Applications
Statistics
ISBN:
9781119256830
Author:
Amos Gilat
Publisher:
John Wiley & Sons Inc

Probability and Statistics for Engineering and th…
Statistics
ISBN:
9781305251809
Author:
Jay L. Devore
Publisher:
Cengage Learning

Statistics for The Behavioral Sciences (MindTap C…
Statistics
ISBN:
9781305504912
Author:
Frederick J Gravetter, Larry B. Wallnau
Publisher:
Cengage Learning
MATLAB: An Introduction with Applications
Statistics
ISBN:
9781119256830
Author:
Amos Gilat
Publisher:
John Wiley & Sons Inc
Probability and Statistics for Engineering and th…
Statistics
ISBN:
9781305251809
Author:
Jay L. Devore
Publisher:
Cengage Learning
Statistics for The Behavioral Sciences (MindTap C…
Statistics
ISBN:
9781305504912
Author:
Frederick J Gravetter, Larry B. Wallnau
Publisher:
Cengage Learning

Elementary Statistics: Picturing the World (7th E…
Statistics
ISBN:
9780134683416
Author:
Ron Larson, Betsy Farber
Publisher:
PEARSON

The Basic Practice of Statistics
Statistics
ISBN:
9781319042578
Author:
David S. Moore, William I. Notz, Michael A. Fligner
Publisher:
W. H. Freeman

Introduction to the Practice of Statistics
Statistics
ISBN:
9781319013387
Author:
David S. Moore, George P. McCabe, Bruce A. Craig
Publisher:
W. H. Freeman