the test statistic number and the P value

MATLAB: An Introduction with Applications
6th Edition
ISBN:9781119256830
Author:Amos Gilat
Publisher:Amos Gilat
Chapter1: Starting With Matlab
Section: Chapter Questions
Problem 1P
icon
Related questions
Question
100%
For some reason I keep getting the test statistic number and the P value number incorrect I don’t know what to do
A myopenmath.com/assess2/?cid%=77770&aid=5557982#/skip/3
ed Sites
A Confirmation - FA...
ca *Search for Class...
StudentLoans.gov
Mind Tap - Cengag... J A New Cons
> Next question
2 Get a similar question
You can retry this question below
The average final exam score for the statistics course is 77%. A professor wants to see if the average final
exam score for students who are given colored pens on the first day of class is different. The final exam
scores for the 15 randomly selected students who were given the colored pens are shown below. Assume
that the distribution of the population is normal.
77, 65, 82, 95, 73, 66, 94, 87, 65, 90, 87, 92, 97, 99, 100
What can be concluded at the the a = 0.10 level of significance level of significance?
a. For this study, we should use t-test for a population mean
b. The null and alternative hypotheses would be:
Họ: Hv
77
H1: pv #
77
c. The test statístic t v =
(please show your answer to 3 decimal places.)
12
tv
MacBook Air
20
D00
F3
F4
FS
F6
F7
FB
Transcribed Image Text:A myopenmath.com/assess2/?cid%=77770&aid=5557982#/skip/3 ed Sites A Confirmation - FA... ca *Search for Class... StudentLoans.gov Mind Tap - Cengag... J A New Cons > Next question 2 Get a similar question You can retry this question below The average final exam score for the statistics course is 77%. A professor wants to see if the average final exam score for students who are given colored pens on the first day of class is different. The final exam scores for the 15 randomly selected students who were given the colored pens are shown below. Assume that the distribution of the population is normal. 77, 65, 82, 95, 73, 66, 94, 87, 65, 90, 87, 92, 97, 99, 100 What can be concluded at the the a = 0.10 level of significance level of significance? a. For this study, we should use t-test for a population mean b. The null and alternative hypotheses would be: Họ: Hv 77 H1: pv # 77 c. The test statístic t v = (please show your answer to 3 decimal places.) 12 tv MacBook Air 20 D00 F3 F4 FS F6 F7 FB
M MyOpenMath
M Final Draft: Paper 2
MTopic: Presentation Submission
A myopenmath.com/assess2/?cid=77770&aid=5557982#/skip/3
rested Sites
* Confirmation - FA...
ca *Search for Class...
StudentLoans.gov
MindTap - Cengag.. J
H1: v
77
c. The test statistic
(please show your answer to 3 decimal places.)
d. The p-value =
(Please show your answer to 4 decimal places.)
e. The p-value is s
f. Based on this, we should reject
g. Thus, the final conclusion is that ...
v the null hypothesis.
O The data suggest that the population mean final exam score for students who`are given
colored pens at the beginning of class is not significantly different from 77 at a = 0.10,
there is statistically insignificant evidence to conclude that the population mean final e
Score for students who are given colored pens at the beginning of class is different from
O The data suggest the populaton mean is significantly different from 77 at a = 0.10, so
statistically significant evidence to conclude that the population mean final exam score
students who are given colored pens at the beginning of class is different from 77.
O The data suggest the population mean is not significantly different from 77 at a = 0.10
there is statistically insignificant evidence to conclude that the population mean final e
Score for students who are given colored pens at the beginning of class is equal to 77.
DEC
12
étv
MacBook Air
Transcribed Image Text:M MyOpenMath M Final Draft: Paper 2 MTopic: Presentation Submission A myopenmath.com/assess2/?cid=77770&aid=5557982#/skip/3 rested Sites * Confirmation - FA... ca *Search for Class... StudentLoans.gov MindTap - Cengag.. J H1: v 77 c. The test statistic (please show your answer to 3 decimal places.) d. The p-value = (Please show your answer to 4 decimal places.) e. The p-value is s f. Based on this, we should reject g. Thus, the final conclusion is that ... v the null hypothesis. O The data suggest that the population mean final exam score for students who`are given colored pens at the beginning of class is not significantly different from 77 at a = 0.10, there is statistically insignificant evidence to conclude that the population mean final e Score for students who are given colored pens at the beginning of class is different from O The data suggest the populaton mean is significantly different from 77 at a = 0.10, so statistically significant evidence to conclude that the population mean final exam score students who are given colored pens at the beginning of class is different from 77. O The data suggest the population mean is not significantly different from 77 at a = 0.10 there is statistically insignificant evidence to conclude that the population mean final e Score for students who are given colored pens at the beginning of class is equal to 77. DEC 12 étv MacBook Air
Expert Solution
Step 1 : Introduction and given information.

Here we are given the average final exam score for the statistics course is 77%. A professor wants to see if the average final exam score for students who are given colored pens on the first day of class is different.

The final exam scores for the 15 randomly selected students are given here and it is as follows;

77,65 ,82 ,95 ,73 ,66 ,94 ,87 ,65 ,90 ,87,92 ,97 ,99 ,100.

Given level of significance ,α = 0.10.

It is asked to find

  1. Which test will we use here.
  2. State the hypotheses.
  3. The test statistic value.
  4. The p-value.
  5. Decision.
  6. Conclusion.

Your answers for part a)  ,  part b)  , Part e) , Part f) and Part g) are absolutely correct. Good job :)

Step 2 : Part c)

It is asked to find test statistic value.

We can easily find this value in TI-84 calculator.

Please refer the following steps.

  1. Press [STAT][ENTER] to enter the Stat List editor. Enter you above given data in L1 column , it will look like , 

Statistics homework question answer, step 2, image 1

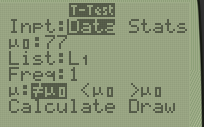
      2. Now again press STAT >> Highlight TESTS >>> a list will appears to you scroll and select 2: T test ,            hit on enter , now here highlight DATA and enter the asked values it will look like as follows;

Statistics homework question answer, step 2, image 2

     3 . Hit on calculate to get the output.

Statistics homework question answer, step 2, image 3

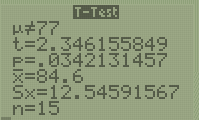
From this output , test statistic , t = 2.346155849 till three decimal places it would be 2.346.

Thus , the test statistic value is 2.346.

steps

Step by step

Solved in 3 steps with 4 images

Blurred answer
Knowledge Booster
Basics of Inferential Statistics
Learn more about
Need a deep-dive on the concept behind this application? Look no further. Learn more about this topic, statistics and related others by exploring similar questions and additional content below.
Similar questions
  • SEE MORE QUESTIONS
Recommended textbooks for you
MATLAB: An Introduction with Applications
Statistics
ISBN:
9781119256830
Author:
Amos Gilat
Publisher:
John Wiley & Sons Inc
Probability and Statistics for Engineering and th…
Statistics
ISBN:
9781305251809
Author:
Jay L. Devore
Publisher:
Cengage Learning
Statistics for The Behavioral Sciences (MindTap C…
Statistics
ISBN:
9781305504912
Author:
Frederick J Gravetter, Larry B. Wallnau
Publisher:
Cengage Learning
Elementary Statistics: Picturing the World (7th E…
Statistics
ISBN:
9780134683416
Author:
Ron Larson, Betsy Farber
Publisher:
PEARSON
The Basic Practice of Statistics
Statistics
ISBN:
9781319042578
Author:
David S. Moore, William I. Notz, Michael A. Fligner
Publisher:
W. H. Freeman
Introduction to the Practice of Statistics
Statistics
ISBN:
9781319013387
Author:
David S. Moore, George P. McCabe, Bruce A. Craig
Publisher:
W. H. Freeman