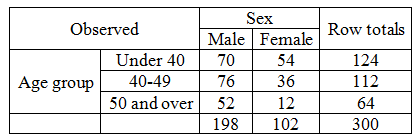
The sexes and ages of a random sample of 300 runners taking part in marathons are classified as follows in the table below. Table: Sexes and ages of runners taking part in marathons. Sex Observed Row totals Male Female Under 40 70 54 124 Age group 40-49 76 36 112 50 and over 52 12 64 Column totals 198 102 300 What is the expected frequency of a female runner between the ages 40-49?
Q: Women in psychology then and now. The following table lists the distribution of degrees in…
A: given frequency distribution
Q: A magazine published data on the best small firms in a certain year. These were firms that had been…
A:
Q: A government bureau would like to estimate the average annual contributions to charity by the…
A:
Q: In a class of applied statistics course, 60 students are sit for the final exam and hence their…
A: Note, Since you have posted a question with multiple sub-parts, we will solve first three sub-parts…
Q: A researcher has collected a random sample of heights of parents and their female children (all…
A: The heights of the mother, father, and daughter are recorded in the following…
Q: The authors of a paper studied a random sample of 343 Twitter users. For each Twitter user in the…
A: Solution: Given information: k=5 Categories n= 343 Sample size pi= 0.20 proportion i=1,2,3,4
Q: Question: Consider a sample of 100 test scores, with the following frequency distribution: Score…
A: score frequency 60-69 15 70-79 25 80-89 30 90-99 25 100 5
Q: The following data lists the ages of a random selection of actresses when they won an award in the…
A: Given that Data of Actor and Actress We have to find t test statistic Pvalue Confidence interval…
Q: Since the critical value is we have sufficient evidence the null hypothesis at a = 0.1 level of…
A: Given: Test statistic = 6.321 significance level, = 0.10
Q: Question 3: The histograms below show for the 432 members of the U.S. House of Representatives on…
A: From the given information, the histogram for the years of service is displayed below. (a) Observe…
Q: This table represents the first 8 observations from a sample of 200 individuals, who reported their…
A: The objective of the question is to identify the type of variable that 'Income' is, based on the…
Q: o study the composition of families in Winslow, Arizona, forty randomly selected married couples…
A: We know that, Mean : It is the sum of set of observations divided by the total number of…
Q: The following table lists the distribution by degrees in psychology conferred by degree-granting…
A: We have given trend of degree confered sex wise since 1970-1971 so we have to find out what is trend…
Q: The following data lists the ages of a random selection of actresses when they won an award in the…
A: Given Information : The provided data lists the ages of a random selection of actresses when they…
Q: The following data lists the ages of a random selection of actresses when they won an award in the…
A: For actress:
Q: The following data lists the ages of a random selection of actresses when they won an award in the…
A: Solution: Given information: Let x=Actress (years) and y=Actor (years) x y d=x-y (d-d) (d-d)2…
Q: Determine the standard error of estimate. (Round your answer to 3 decimal places.) b.…
A: 1) The coefficient of determination, which is a measure of goodness of fit for a linear regression…
Q: The following data lists the ages of a random selection of actresses when they won an award in the…
A: The actresses are selected randomly and the age at which they won the best actress award are noted…
Q: ished data on the best small firms in a certain year. These were firms that had been publicly traded…
A: The table that shows the necessary calculations is shown below: x x−¯x (x−¯x)2 49 -7.5333…
Q: Foxbees magazine published data on the best small firms in 2012. These publicly traded firms have a…
A: Formula Used: Sample mean X = ∑Xin Sample standard deviation S = ∑Xi-X2n-1 Standard error = Standard…
Q: A magazine published data on the best small firms in a certain year. These were firms that had been…
A: Random Sample :47 59 51 61 55 59 74 63 53 50 59 60 60 57 46 55 63 57 47 55 57 43 61 62 49 67 67 55…
Q: A magazine published data on the best small firms in a certain year. These were firms that had been…
A: Sample size (n) = 30Confidence level = 90%
Q: The top 12 movies that have earned the most revenue (in millions of dollars) in a particular region…
A:
Q: The following data lists the ages of a random selection of actresses when they won an award in the…
A: (a) State the hypotheses. That is, there is no evidence to conclude that difference between the…
Q: par (b) beloW. ss (years) 30 30 30 30 32 27 23 39 27 35 O (years) 67 35 33 35 26 33 46 37 40 45…
A: a) By applying a pared 't-test,
Q: An article about the California lottery gave the following information on the age distribution of…
A:
Q: The Pew Research Center conducted two surveys, one in December 2011 and another in November 2012,…
A: Note: As two series of data- collected on December 2011 and on November 2012 are to be compared, a…
Q: The following data provides the monthly streaming bill for a random sample of 20 households along…
A: Given data: Bill Amount ($) TVs People Years as Customer 56 1 3 8 59 3 5 11 67 3 2 3 75 2…
Q: The following data lists the ages of a random selection of actresses when they won an award in the…
A:
Q: The following data lists the ages of a random selection of actresses when they won an award in the…
A: Let d denote the actress's age minus the actors age Let μd denote the mean value of the difference d…
Q: Twittering away The Pew Internet and American Life Project asked a random sample of 2253 U.S.…
A: Given Information: Sample size n=2253 Sample proportion p^=0.19
Q: The following data lists the ages of a random selection of actresses when they won an award in the…
A: Let d be a random variable, defined as the difference between the Age of the Actress who won the…
Q: The following data lists the ages of a random selection of actresses when they won an award in the…
A:
Q: Foxbees magazine published data on the best small firms in 2012. These publicly traded firms have a…
A: The 99% confidence interval for the true mean age of CEOs for the best small firms, will signify…
Q: The first, second, and third quartile of age at diagnosis of breast cancer among Asian Americans are…
A: Given first quartile is 42 yearsSecond quartile is 54 yearsThird quartile is 62 years.There is a…
Q: The following data lists the ages of a random selection of actresses when they won an award in the…
A: Degrees of freedom = n-1 =9
Q: The following data lists the ages of a random selection of actresses when they won an award in the…
A: We have given the following data lists the ages of a random selection of actresses when they won an…
Q: corporate CEOs for a random sample of these firms. 47 57 52 62 55 59 74 63 53 50 59 60 60 57 46 55…
A: Let X be the age of CEOs for top small firms. x¯ : Sample mean of age of CEOs for top small firms.…
Q: How do the average weekly incomes of electricians and carpenters compare? A random sample of 17…
A: Given: a) The level of significance (α) = 10% that is 0.10 Sample size (n) = 17 The hypotheses are…
Q: a. Use the sample data with a 0.05 significance level to test the claim that for the population of…
A:
Q: Find the mean and standard deviation for each sample of values. (Round your answers to three decimal…
A: The mean value gives an idea of the central or the average value of the data.
Q: WAKE UP DURING THE NIGHT GENDER Yes No TOTAL Female 125 25 150 Male 91 30 121 TOTAL…
A: The probability for an event (i.e., the event of "waking up during the night with respect to gender"…
Q: A statistics professor would like to build a model relating student scores on the first test to the…
A: Here we are using R programming language statistical software-
Q: respectively. At the 0.1 significance level, test the claim that the distribution of crashes…
A: The following table is provided regarding the number of car crashes caused by drivers of certain…
Solution:
The given table of data is
Step by step
Solved in 2 steps with 3 images
- A local bookstore arranges book counter in different schools around the year. The CEO says that, compare to last year, the number of orders received in school has been dropped this year. The table below shows the number of orders received in a random sample of 14 schools in this year and last year. School 1 3 4 6. 8. 9. 10 11 12 13 14 This year 85 35 96 45 33 52 67 77 45 67 43 76 80 65 Last year 92 38 93 81 42 50 61 89 56 63 49 65 92 81 Test, at 5% level of significance, is there sufficient evidence to conclude that the CEO's statement is correct. (The test report must include (i) null hypothesis and alternative hypothesis, (ii) rejection region, (iii) calculation of test statistics, and (iv) conclusion.)The following table contains the first exam score and the second exam score for a random sample of 15 students in a large college class. 78 89 75 89.5 86 84 81 77 79 84.5 82.5 83.5 78.5 75.5 85 First exam score 83 82.5 71.5 86.5 79 81 71.5 84.5 Second exam score 78.5 84 71.5 85 72.5 72.5 78 5 -5.5 3.5 6.5 4.5 Difference (a) Find the value of the test statistic. (b) Find the critical value. (c) Decide whether to reject Ho (Choose one) 4 0 Yes ▼ I Don't Know At the 0.02 level of significance, can we conclude (by using the Wilcoxon signed-ranks test) that there is a difference between the populations of first and second exam scores for students in this class? Perform a test by completing the parts below. (If necessary, consult a table with critical values for the Wilcoxon signed ranks test.) 8.5 No 4.5 Submit 1 1.5 0 PRO 3 (d) At the 0.02 level, can we conclude that there is a difference between the populations of first and second exam scores for students in this class? 7 3 F6 X F7 2022…The following data lists the ages of a random selection of actresses when they won an award in the category of Best Actress, along with the ages of actors when they won in the category of Best Actor. The ages are matched according to the year that the awards were presented. Complete parts (a) and (b) below. Actress (years) 31 Actor (years) 27 28 27 33 27 29 40 32 32 9 62 34 39 41 29 35 53 41 41 42 a. Use the sample data with a 0.01 significance level to test the claim that for the population of ages of Best Actresses and Best Actors, the differences have a mean less than 0 (indicating that the Best Actresses are generally younger than Best Actors). In this example, Hg is the mean value of the differences d for the population of all pairs of data, where each individual difference d is defined as the actress's age minus the actor's age. What are the null and alternative hypotheses for the hypothesis test? Ho: Hd year(s) H1: Hd year(s) (Type integers or decimals. Do not round.) Identify…
- The following data lists the ages of a random selection of actresses when they won an award in the category of Best Actress, along with the ages of actors when they won in the category of Best Actor. The ages are matched according to the year that the awards were presented. Complete parts (a) and (b) below. Actress (years) 25 27 28 28 37 26 25 44 27 33 O Actor (years) 59 35 35 39 29 37 55 35 37 39 a. Use the sample data with a 0.01 significance level to test the claim that for the population of ages of Best Actresses and Best Actors, the differences have a mean less than 0 (indicating that the Best Actresses are generally younger than Best Actors). In this example, Ha is the mean value of the differences d for the population of all pairs of data, where each individual difference d is defined as the actress's age minus the actor's age. What are the null and alternative hypotheses for the hypothesis test? Ho: Hdl year(s) H1: Hal (Type integers or decimals. Do not round.) year(s) Get more…A researcher took a random sample of 200 new mothers in the United States (Group 1) and found that 16% of them experienced some form of postpartum depression. Another random sample of 200 new mothers in France (Group 2), where mothers receive 16 weeks of paid maternity leave, found that 11% experienced some form of postpartum depression. Can it be concluded that the percent of women in the United States experience more postpartum depression than the percent of women in France? Use α=0.05. Select the correct alternative hypothesis and decisionHow do the average weekly incomes of electricians and carpenters compare? A random sample of 17 regions in the United States gave the following information about average weekly income (in dollars). (Reference: U.S. Department of Labor, Bureau of Labor Statistics.) Region 1 2 3 4 5 6 7 8 9 Electricians 464 715 597 464 736 694 744 571 806 Carpenters 542 813 513 476 688 503 789 653 474 Region 10 11 12 13 14 15 16 17 Electricians 592 594 702 579 868 598 597 654 Carpenters 489 647 676 384 817 605 556 505 Does this information indicate a difference (either way) in the average weekly incomes of electricians compared to those of carpenters? Use a 5% level of significance. (a) What is the level of significance? (b) Compute the sample test statistic. (c) Find the P-value of the sample test statistic.
- The following data lists the ages of a random selection of actresses when they won an award in the category of Best Actress, along with the ages of actors when they won in the category of Best Actor. The ages are matched according to the year that the awards were presented. Complete parts (a) and (b) below. Actress (years) 30 Actor (years) 27 32 30 38 27 25 45 32 36 O 58 40 38 37 28 31 51 40 40 44 a. Use the sample data with a 0.01 significance level to test the claim that for the population of ages of Best Actresses and Best Actors, the differences have a mean less than 0 (indicating that the Best Actresses are generally younger than Best Actors). In this example, H. is the mean value of the differences d for the population of all pairs of data, where each individual difference d is defined as the actress's age minus the actor's age. What are the null and alternative hypotheses for the hypothesis test? Ho: Hd year(s) H: Hd year(s) (Type integers or decimals. Do not round.)Is there an association between hair color and body type? The table below shows the results of a researcher's observations of randomly selected people. Frequencies of Hair Colors for Various Body Types Blonde Brunette Red Head 71 80 96 108 55 115 46 91 Short and Slender Short and Pudgy Tall and Slender Tall and Heavy What can be concluded at the o= 0.01 significance level? 53 74 69 63The following data lists the ages of a random selection of actresses when they won an award in the category of Best Actress, along with the ages of actors when they won in the category of Best Actor. The ages are matched according to the year that the awards were presented. Complete parts (a) and (b) below. Actress (years) 27 31 29 31 34 23 28 37 33 31 D Actor (years) 67 41 36 42 26 35 46 40 37 39 Họ: Ha year(s) H7: Ha v (Type integers or decimals. Do not round.) year(s) Identify the test statistic. t = (Round to two decimal places as needed.) Identify the P-value, P-value = (Round to three decimal places as needed.) What is the conclusion based on the hypothesis test? Since the P-value is V the significance level, V the null hypothesis. There sufficient evidence to support the claim that actresses are generally younger when they won the award than actors. b. Construct the confidence interval that could be used for the hypothesis test described in part (a). What feature of the…