The percentage of people with an unfavorable view of the Tea Party in a recent New York Times/CBS News Poll was higher than it has been since the first time the question was asked, in April 2010. Of the 960 individuals polled this week, 38% characterized their view as “not favorable,” compared with 21% of the 960 individuals sampled in the first poll. Obtain a 95% confidence interval for the percentage of all American adults who have a negative view of the Tea Party in this most recent poll.
The percentage of people with an unfavorable view of the Tea Party in a recent New York Times/CBS News Poll was higher than it has been since the first time the question was asked, in April 2010. Of the 960 individuals polled this week, 38% characterized their view as “not favorable,” compared with 21% of the 960 individuals sampled in the first poll.
Obtain a 95% confidence interval for the percentage of all American adults who have a negative view of the Tea Party in this most recent poll.
Obtain the 95% confidence interval for the percentage of all American adults who have a negative view of the Tea Party in this most recent poll.
The 95% confidence interval for the percentage of all American adults who have a negative view of the Tea Party in this most recent poll is obtained below:

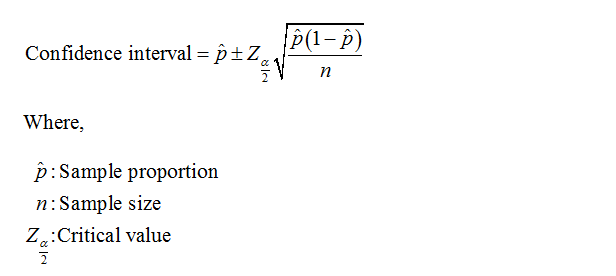
The formula for the confidence interval for the proportion is,

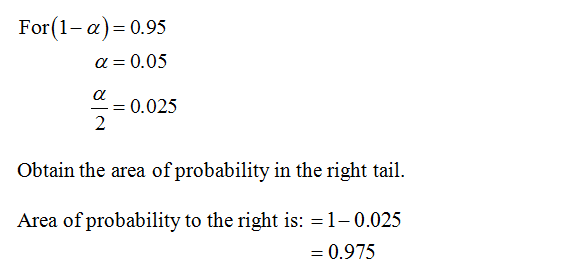
Obtain the critical value of z at the 95% confidence level.
Here, confidence level is 0.95.

Use EXCEL Procedure for finding the critical value of z.
Follow the instruction to obtain the critical value of z:
- Open EXCEL
- Go to Formula bar.
- In formula bar enter the function as“=NORMINV”
- Enter the probability as 0.975.
- Enter the mean as 0 and the Standard deviation as 1.
- Click enter
EXCEL output:
From the EXCEL output, the critical value of z at the 95% confidence level is 1.96.
Step by step
Solved in 2 steps with 4 images


