The number of pair days off taken by eight employees at a local small business is compared to the national average. You are hired by the business owner, who has been in business for just 18 months, to help her determine what to expect for paid days off. In general, she wants to set some standard for her employees and for herself. Let's assume your search on the internet for data on paid days off leaves you with the impression that the national average is 15 days. The data for the eight local employees during the last fiscal year are: 10, 11, 8, 14, 13, 12, 12, and 27 days. 1. Calculate the appropriate t statistic. 2. Draw a statistical conclusion. 3. Calculate and interpret the effect size.
The number of pair days off taken by eight employees at a local small business is compared to the national average. You are hired by the business owner, who has been in business for just 18 months, to help her determine what to expect for paid days off. In general, she wants to set some standard for her employees and for herself. Let's assume your search on the internet for data on paid days off leaves you with the impression that the national average is 15 days. The data for the eight local employees during the last fiscal year are: 10, 11, 8, 14, 13, 12, 12, and 27 days.
1. Calculate the appropriate t statistic.
2. Draw a statistical conclusion.
3. Calculate and interpret the effect size.
Given Information :
The number of pair days off taken by eight employees at a local small business is compared to the national average. You are hired by the business owner, who has been in business for just 18 months, to help her determine what to expect for paid days off. In general, she wants to set some standard for her employees and for herself. Let's assume your search on the internet for data on paid days off leaves you with the impression that the national average is 15 days. The data for the eight local employees during the last fiscal year are: 10, 11, 8, 14, 13, 12, 12, and 27 days.
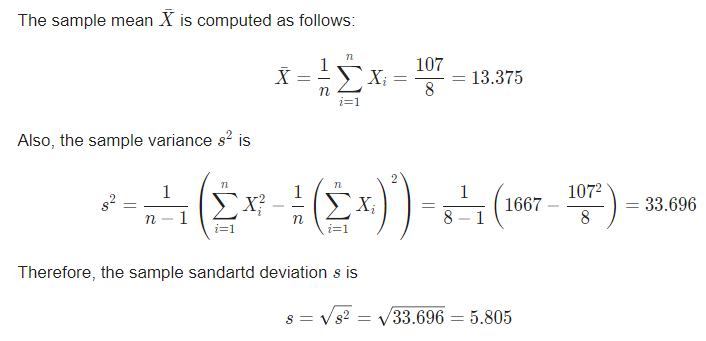
The sample size is . The provided sample data along with the data required to compute the sample mean and sample variance are shown in the table below:
| X | X2 | |
| 10 | 100 | |
| 11 | 121 | |
| 8 | 64 | |
| 14 | 196 | |
| 13 | 169 | |
| 12 | 144 | |
| 12 | 144 | |
| 27 | 729 | |
| Sum = | 107 | 1667 |

Step by step
Solved in 2 steps with 2 images


