• The null Hypothesis Ho is [ Select ] • The alternative hypothesis Ha is [ Select ] • The t statistic is = [ Select ] • The p-value is = [5 • The test indicates that: [ Select ] > >
• The null Hypothesis Ho is [ Select ] • The alternative hypothesis Ha is [ Select ] • The t statistic is = [ Select ] • The p-value is = [5 • The test indicates that: [ Select ] > >

MATLAB: An Introduction with Applications
6th Edition
ISBN:9781119256830
Author:Amos Gilat
Publisher:Amos Gilat
Chapter1: Starting With Matlab
Section: Chapter Questions
Problem 1P

Related questions
Question
Sauces_Data
| Store | Sales | Sauce type |
| 1 | 169 | Sauce1 |
| 2 | 242 | Sauce1 |
| 3 | 175 | Sauce1 |
| 4 | 253 | Sauce1 |
| 5 | 236 | Sauce1 |
| 6 | 158 | Sauce1 |
| 7 | 231 | Sauce1 |
| 8 | 205 | Sauce1 |
| 9 | 169 | Sauce1 |
| 10 | 178 | Sauce1 |
| 11 | 200 | Sauce1 |
| 12 | 200 | Sauce1 |
| 13 | 229 | Sauce1 |
| 14 | 230 | Sauce1 |
| 15 | 193 | Sauce1 |
| 16 | 234 | Sauce1 |
| 17 | 218 | Sauce1 |
| 18 | 211 | Sauce1 |
| 19 | 218 | Sauce1 |
| 20 | 152 | Sauce1 |
| 21 | 223 | Sauce1 |
| 22 | 174 | Sauce1 |
| 23 | 225 | Sauce1 |
| 24 | 194 | Sauce1 |
| 25 | 197 | Sauce1 |
| 26 | 223 | Sauce1 |
| 27 | 150 | Sauce1 |
| 28 | 190 | Sauce1 |
| 29 | 196 | Sauce1 |
| 30 | 202 | Sauce1 |
| 31 | 197 | Sauce1 |
| 32 | 220 | Sauce1 |
| 33 | 245 | Sauce1 |
| 34 | 196 | Sauce1 |
| 35 | 222 | Sauce1 |
| 36 | 202 | Sauce1 |
| 37 | 289 | Sauce1 |
| 38 | 229 | Sauce1 |
| 39 | 193 | Sauce1 |
| 40 | 216 | Sauce1 |
| 41 | 160 | Sauce2 |
| 42 | 209 | Sauce2 |
| 43 | 175 | Sauce2 |
| 44 | 172 | Sauce2 |
| 45 | 206 | Sauce2 |
| 46 | 188 | Sauce2 |
| 47 | 185 | Sauce2 |
| 48 | 171 | Sauce2 |
| 49 | 175 | Sauce2 |
| 50 | 207 | Sauce2 |
| 51 | 209 | Sauce2 |
| 52 | 207 | Sauce2 |
| 53 | 181 | Sauce2 |
| 54 | 222 | Sauce2 |
| 55 | 197 | Sauce2 |
| 56 | 166 | Sauce2 |
| 57 | 189 | Sauce2 |
| 58 | 178 | Sauce2 |
| 59 | 167 | Sauce2 |
| 60 | 210 | Sauce2 |
| 61 | 228 | Sauce2 |
| 62 | 241 | Sauce2 |
| 63 | 167 | Sauce2 |
| 64 | 189 | Sauce2 |
| 65 | 191 | Sauce2 |
| 66 | 224 | Sauce2 |
| 67 | 151 | Sauce2 |
| 68 | 220 | Sauce2 |
| 69 | 202 | Sauce2 |
| 70 | 220 | Sauce2 |
| 71 | 184 | Sauce2 |
| 72 | 205 | Sauce2 |
| 73 | 216 | Sauce2 |
| 74 | 201 | Sauce2 |
| 75 | 208 | Sauce2 |
| 76 | 187 | Sauce2 |
| 77 | 197 | Sauce2 |
| 78 | 197 | Sauce2 |
| 79 | 195 | Sauce2 |
| 80 | 200 | Sauce2 |
![A chicken wings restaurant chain has developed two new special sauces, the 'cheesy-cheeses' and the 'super-duper hot' (let's better call them Sauce1 and Sauce2 respectively). The company has funds to invest in only one of the two sauces so management wants to determine which one is more appealing for customers. They randomly choose 80 of its restaurants around the country (all about the same size and overall sales volume) and offers Sauce1 at 40 of these sites, and Sauce2 at the other 40 sites. The file Sauces Data.xlsx has 80 observations on two variables:
- Sales: number of chicken wings with each of the new sauces sold in the 40 restaurants during the first week of the promotion
- Sauce Type: Sauce1 if the wings were sold with Sauce1; Sauce2 if the wings were sold with Sauce2.
Management suspects that launching Sauce 1 is a better strategy and they want to test this hypothesis using the data from the 80 sample data.
- The null Hypothesis Ho is [ Select ]
- The alternative hypothesis Ha is [ Select ]
- The t statistic is = [ Select ]
- The p-value is = [ Select ]
- The test indicates that: [ Select ]](/v2/_next/image?url=https%3A%2F%2Fcontent.bartleby.com%2Fqna-images%2Fquestion%2F9fb0f0f8-9d27-42ce-8005-a3193e0b2b43%2F14321442-6c91-483c-8f5e-8d5494cfff04%2F4mx3qqu_processed.png&w=3840&q=75)
Transcribed Image Text:A chicken wings restaurant chain has developed two new special sauces, the 'cheesy-cheeses' and the 'super-duper hot' (let's better call them Sauce1 and Sauce2 respectively). The company has funds to invest in only one of the two sauces so management wants to determine which one is more appealing for customers. They randomly choose 80 of its restaurants around the country (all about the same size and overall sales volume) and offers Sauce1 at 40 of these sites, and Sauce2 at the other 40 sites. The file Sauces Data.xlsx has 80 observations on two variables:
- Sales: number of chicken wings with each of the new sauces sold in the 40 restaurants during the first week of the promotion
- Sauce Type: Sauce1 if the wings were sold with Sauce1; Sauce2 if the wings were sold with Sauce2.
Management suspects that launching Sauce 1 is a better strategy and they want to test this hypothesis using the data from the 80 sample data.
- The null Hypothesis Ho is [ Select ]
- The alternative hypothesis Ha is [ Select ]
- The t statistic is = [ Select ]
- The p-value is = [ Select ]
- The test indicates that: [ Select ]
Expert Solution
Step 1
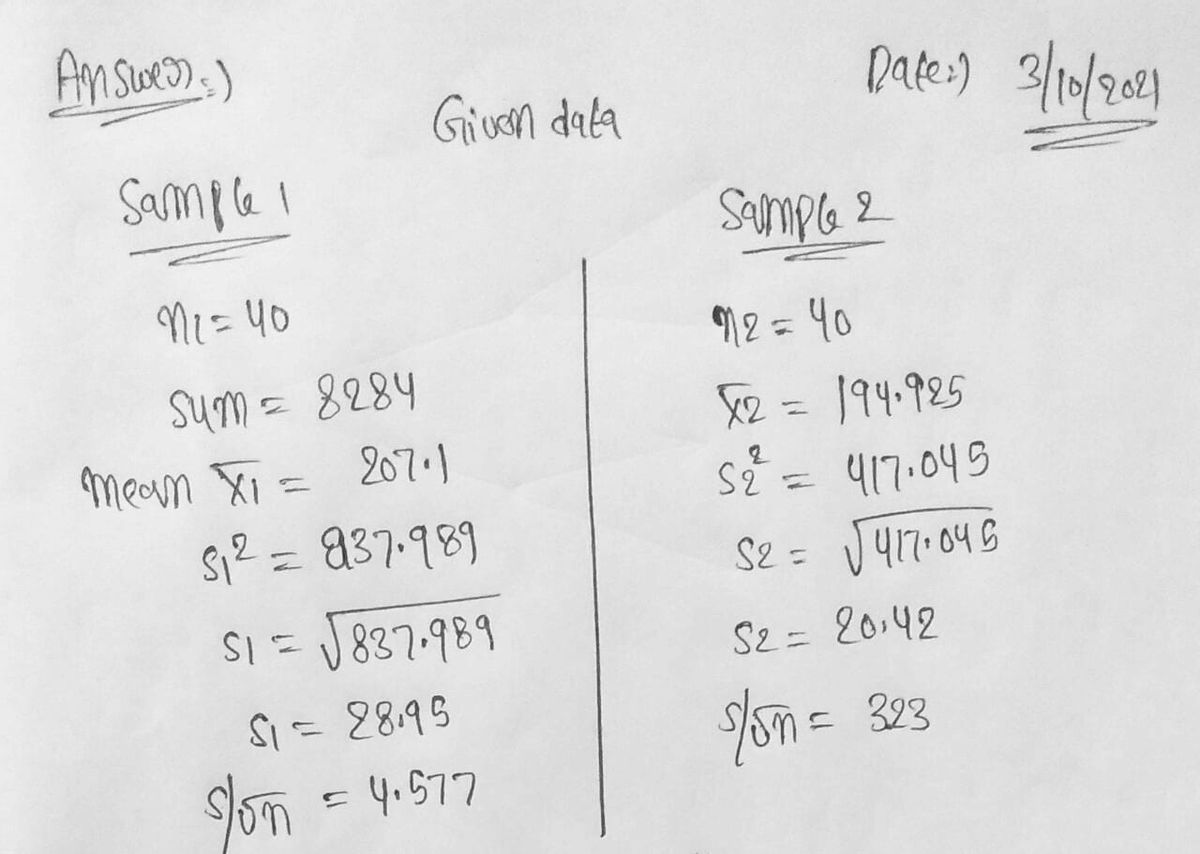
Answer:----. Date:----3/10/2021

Step by step
Solved in 2 steps with 2 images

Recommended textbooks for you
MATLAB: An Introduction with Applications
Statistics
ISBN:
9781119256830
Author:
Amos Gilat
Publisher:
John Wiley & Sons Inc

Probability and Statistics for Engineering and th…
Statistics
ISBN:
9781305251809
Author:
Jay L. Devore
Publisher:
Cengage Learning

Statistics for The Behavioral Sciences (MindTap C…
Statistics
ISBN:
9781305504912
Author:
Frederick J Gravetter, Larry B. Wallnau
Publisher:
Cengage Learning
MATLAB: An Introduction with Applications
Statistics
ISBN:
9781119256830
Author:
Amos Gilat
Publisher:
John Wiley & Sons Inc
Probability and Statistics for Engineering and th…
Statistics
ISBN:
9781305251809
Author:
Jay L. Devore
Publisher:
Cengage Learning
Statistics for The Behavioral Sciences (MindTap C…
Statistics
ISBN:
9781305504912
Author:
Frederick J Gravetter, Larry B. Wallnau
Publisher:
Cengage Learning

Elementary Statistics: Picturing the World (7th E…
Statistics
ISBN:
9780134683416
Author:
Ron Larson, Betsy Farber
Publisher:
PEARSON

The Basic Practice of Statistics
Statistics
ISBN:
9781319042578
Author:
David S. Moore, William I. Notz, Michael A. Fligner
Publisher:
W. H. Freeman

Introduction to the Practice of Statistics
Statistics
ISBN:
9781319013387
Author:
David S. Moore, George P. McCabe, Bruce A. Craig
Publisher:
W. H. Freeman