The mean serum-creatinine level measured in 13 patients 24 hours after they received a newly proposed antibiotic was 1.2 mg/dL. You can use SALT to answer parts of this question. (a) If the mean and standard deviation of serum creatinine in the general population are 1.0 and 0.4 mg/dL, respectively, then, using a significance level of 0.05, test whether the mean serum- creatinine level in this group is different from that of the general population. State the null and alternative hypotheses (in mg/dL). (Enter != for as needed.) Ho: H₁: Find the test statistic. (Round your answer to two decimal places.) Find the rejection region. (Round your answers to two decimal places. If the test is one-sided, enter NONE for the unused region.) test statistic > test statistic < State your conclusion. O Fail to reject Ho. There is insufficient evidence to conclude that the mean serum-creatinine level in this particular group of patients is different from that of the general population. O Reject Ho. There is insufficient evidence to conclude that the mean serum-creatinine level in this particular group of patients is different from that of the general population. O Reject Ho. There is sufficient evidence to conclude that the mean serum-creatinine level in this particular group of patients is different from that of the general population. O Fail to reject Ho. There is sufficient evidence to conclude that the mean serum-creatinine level in this particular group of patients is different from that of the general population. (b) What is the p-value for the test? (Use technology to find the p-value. Round your answer to four decimal places.) p-value = (c) Suppose the sample standard deviation of serum creatinine in part (a) is 0.7 mg/dL. Assume that the standard deviation of serum creatinine is not known, and perform the hypothesis test in part (a). Report a p-value. Find the test statistic. (Round your answer to two decimal places.) 0.72 x Use technology to report a p-value. (Round your answer to four decimal places.) p-value = 0.4847 x
The mean serum-creatinine level measured in 13 patients 24 hours after they received a newly proposed antibiotic was 1.2 mg/dL. You can use SALT to answer parts of this question. (a) If the mean and standard deviation of serum creatinine in the general population are 1.0 and 0.4 mg/dL, respectively, then, using a significance level of 0.05, test whether the mean serum- creatinine level in this group is different from that of the general population. State the null and alternative hypotheses (in mg/dL). (Enter != for as needed.) Ho: H₁: Find the test statistic. (Round your answer to two decimal places.) Find the rejection region. (Round your answers to two decimal places. If the test is one-sided, enter NONE for the unused region.) test statistic > test statistic < State your conclusion. O Fail to reject Ho. There is insufficient evidence to conclude that the mean serum-creatinine level in this particular group of patients is different from that of the general population. O Reject Ho. There is insufficient evidence to conclude that the mean serum-creatinine level in this particular group of patients is different from that of the general population. O Reject Ho. There is sufficient evidence to conclude that the mean serum-creatinine level in this particular group of patients is different from that of the general population. O Fail to reject Ho. There is sufficient evidence to conclude that the mean serum-creatinine level in this particular group of patients is different from that of the general population. (b) What is the p-value for the test? (Use technology to find the p-value. Round your answer to four decimal places.) p-value = (c) Suppose the sample standard deviation of serum creatinine in part (a) is 0.7 mg/dL. Assume that the standard deviation of serum creatinine is not known, and perform the hypothesis test in part (a). Report a p-value. Find the test statistic. (Round your answer to two decimal places.) 0.72 x Use technology to report a p-value. (Round your answer to four decimal places.) p-value = 0.4847 x

MATLAB: An Introduction with Applications
6th Edition
ISBN:9781119256830
Author:Amos Gilat
Publisher:Amos Gilat
Chapter1: Starting With Matlab
Section: Chapter Questions
Problem 1P

Related questions
Question
Please answer a,b,c

Transcribed Image Text:The mean serum-creatinine level measured in 13 patients 24 hours after they received a newly proposed antibiotic was 1.2 mg/dL.
You can use SALT to answer parts of this question.
(a) If the mean and standard deviation of serum creatinine in the general population are 1.0 and 0.4 mg/dL, respectively, then, using a significance level of 0.05, test whether the mean serum-
creatinine level in this group is different from that of the general population.
State the null and alternative hypotheses (in mg/dL). (Enter != for as needed.)
Ho
H₁:
Find the test statistic. (Round your answer to two decimal places.)
Find the rejection region. (Round your answers to two decimal places. If the test is one-sided, enter NONE for the unused region.)
test statistic >
test statistic <
State your conclusion.
O Fail to reject Ho. There is insufficient evidence to conclude that the mean serum-creatinine level in this particular group of patients is different from that of the general population.
O Reject Ho. There is insufficient evidence to conclude that the mean serum-creatinine level in this particular group of patients is different from that of the general population.
O Reject Ho. There is sufficient evidence to conclude that the mean serum-creatinine level in this particular group of patients is different from that of the general population.
O Fail to reject Ho. There is sufficient evidence to conclude that the mean serum-creatinine level in this particular group of patients is different from that of the general population.
(b) What is the p-value for the test? (Use technology to find the p-value. Round your answer to four decimal places.)
p-value =
(c) Suppose the sample standard deviation of serum creatinine in part (a) is 0.7 mg/dL. Assume that the standard deviation of serum creatinine is not known, and perform the hypothesis test in
part (a). Report a p-value.
Find the test statistic. (Round your answer to two decimal places.)
0.72
X
Use technology to report a p-value. (Round your answer to four decimal places.)
p-value = 0.4847
X
Expert Solution
Step 1
Given that
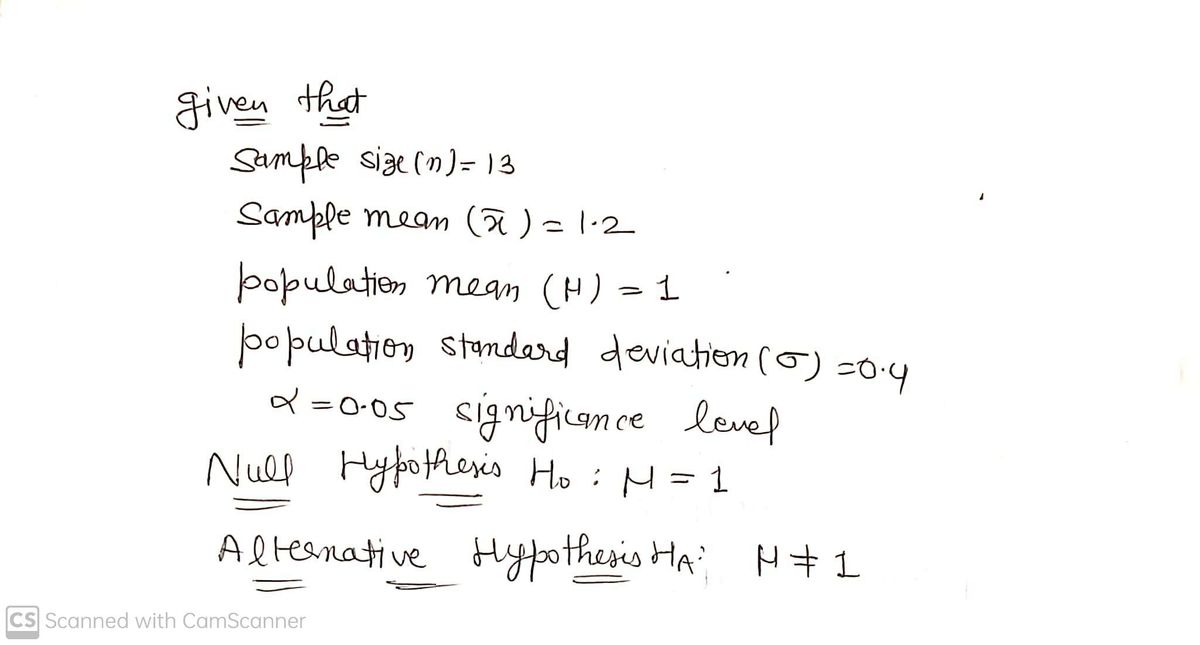
a...We have to test hypothesis for the claim that population mean is different than 1
b..and find p value
c..If population standard deviation is unknown then test hypothesis

Step by step
Solved in 3 steps with 3 images

Recommended textbooks for you
MATLAB: An Introduction with Applications
Statistics
ISBN:
9781119256830
Author:
Amos Gilat
Publisher:
John Wiley & Sons Inc

Probability and Statistics for Engineering and th…
Statistics
ISBN:
9781305251809
Author:
Jay L. Devore
Publisher:
Cengage Learning

Statistics for The Behavioral Sciences (MindTap C…
Statistics
ISBN:
9781305504912
Author:
Frederick J Gravetter, Larry B. Wallnau
Publisher:
Cengage Learning
MATLAB: An Introduction with Applications
Statistics
ISBN:
9781119256830
Author:
Amos Gilat
Publisher:
John Wiley & Sons Inc
Probability and Statistics for Engineering and th…
Statistics
ISBN:
9781305251809
Author:
Jay L. Devore
Publisher:
Cengage Learning
Statistics for The Behavioral Sciences (MindTap C…
Statistics
ISBN:
9781305504912
Author:
Frederick J Gravetter, Larry B. Wallnau
Publisher:
Cengage Learning

Elementary Statistics: Picturing the World (7th E…
Statistics
ISBN:
9780134683416
Author:
Ron Larson, Betsy Farber
Publisher:
PEARSON

The Basic Practice of Statistics
Statistics
ISBN:
9781319042578
Author:
David S. Moore, William I. Notz, Michael A. Fligner
Publisher:
W. H. Freeman

Introduction to the Practice of Statistics
Statistics
ISBN:
9781319013387
Author:
David S. Moore, George P. McCabe, Bruce A. Craig
Publisher:
W. H. Freeman