(iv.) Determine the population of fish in the lake at the end of the fourth year? (c) Evaluate

Calculus: Early Transcendentals
8th Edition
ISBN:9781285741550
Author:James Stewart
Publisher:James Stewart
Chapter1: Functions And Models
Section: Chapter Questions
Problem 1RCC: (a) What is a function? What are its domain and range? (b) What is the graph of a function? (c) How...
icon
Related questions
icon
Concept explainers
Topic Video
Question

Don't need help with a, b, or ii. Only need help with iv and c.

**Problem Statement:**

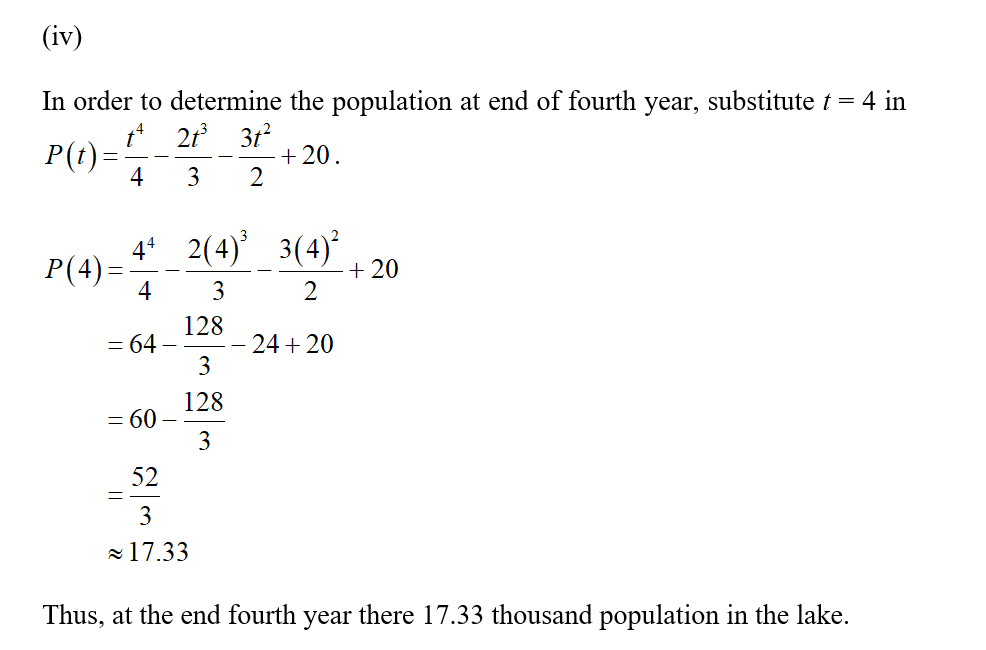
**(iv.)** Determine the population of fish in the lake at the end of the fourth year?

**(c)** Evaluate the integral from 0 to 4 of the absolute value of the derivative of \( P(t) \), given by \( \int_{0}^{4} \left| P'(t) \right| dt \).
Transcribed Image Text:**Problem Statement:** **(iv.)** Determine the population of fish in the lake at the end of the fourth year? **(c)** Evaluate the integral from 0 to 4 of the absolute value of the derivative of \( P(t) \), given by \( \int_{0}^{4} \left| P'(t) \right| dt \).
**Problem 4: Fish Population Modeling in a Lake**

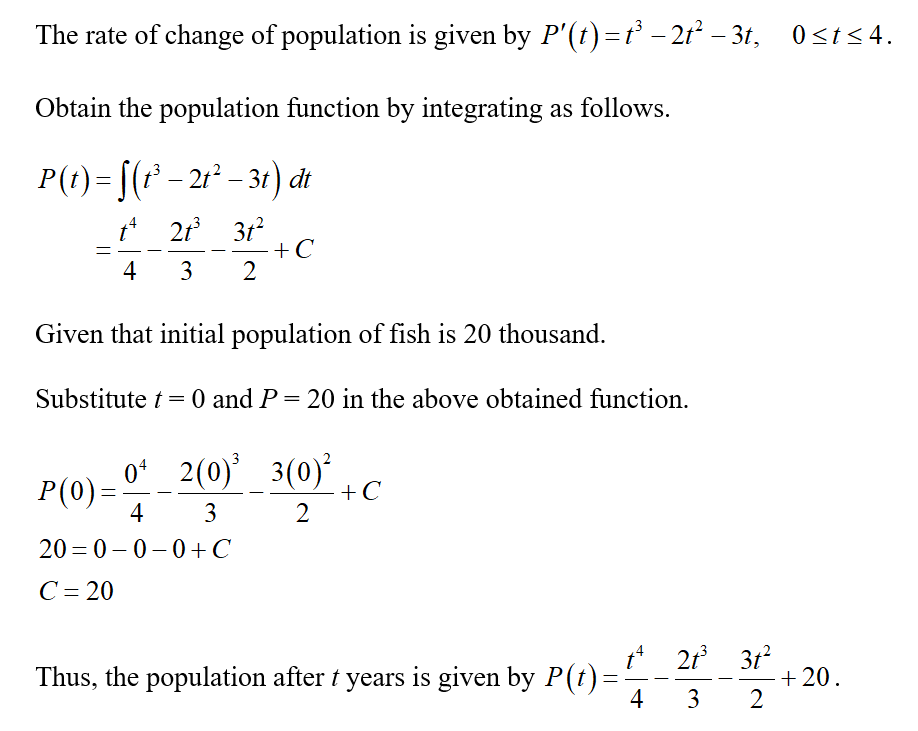
Let \(P(t)\) represent the population of fish (in thousands) in a lake. Suppose that the rate of change of population of a certain type of fish in a lake is given by \( P'(t) = t^3 - 2t^2 - 3t \), for \(0 \le t \le 4\) years, and that the initial population of fish in the lake is 20 thousand.

**(a) Graph \( P'(t) \) vs \( t \):**
Carefully graph \( P'(t) \) vs \( t \), \( 0 \le t \le 4 \), by plotting points and then connecting the points with a smooth line.

*Explanation of the Graph:*
- The graph needs to plot \( P'(t) = t^3 - 2t^2 - 3t \) for the given interval.
- Identify key points by substituting specific values of \( t \) (such as \( t = 0, 1, 2, 3, 4 \)) into \( P'(t) \).
- Plot these points on a coordinate system where the x-axis represents years (\( t \)) from 0 to 4, and the y-axis represents the rate of change of the fish population (\( P'(t) \)).
- Once the points are plotted, connect them with a smooth line to represent the continuous nature of the function.

**(b) Evaluate the following definite integrals and describe their biological meaning:**

(i) \( \int_{0}^{1} P'(t) \, dt \).

*Explanation:*
- To evaluate this integral, compute the definite integral of \( P'(t) \) from \( t = 0 \) to \( t = 1 \).
- The value obtained from this integral represents the total change in the fish population (in thousands) from year 0 to year 1. 

By evaluating this integral, we can understand the net effect of the fish population growth and decline over the first year considering the given rate of change.

Note: The specific numeric evaluation of the integral is not provided in the text and requires performing the integration process. However, the integral calculation would typically involve finding the antiderivative of \( P'(t) \) and then applying the limits from 0 to 1.
Transcribed Image Text:**Problem 4: Fish Population Modeling in a Lake** Let \(P(t)\) represent the population of fish (in thousands) in a lake. Suppose that the rate of change of population of a certain type of fish in a lake is given by \( P'(t) = t^3 - 2t^2 - 3t \), for \(0 \le t \le 4\) years, and that the initial population of fish in the lake is 20 thousand. **(a) Graph \( P'(t) \) vs \( t \):** Carefully graph \( P'(t) \) vs \( t \), \( 0 \le t \le 4 \), by plotting points and then connecting the points with a smooth line. *Explanation of the Graph:* - The graph needs to plot \( P'(t) = t^3 - 2t^2 - 3t \) for the given interval. - Identify key points by substituting specific values of \( t \) (such as \( t = 0, 1, 2, 3, 4 \)) into \( P'(t) \). - Plot these points on a coordinate system where the x-axis represents years (\( t \)) from 0 to 4, and the y-axis represents the rate of change of the fish population (\( P'(t) \)). - Once the points are plotted, connect them with a smooth line to represent the continuous nature of the function. **(b) Evaluate the following definite integrals and describe their biological meaning:** (i) \( \int_{0}^{1} P'(t) \, dt \). *Explanation:* - To evaluate this integral, compute the definite integral of \( P'(t) \) from \( t = 0 \) to \( t = 1 \). - The value obtained from this integral represents the total change in the fish population (in thousands) from year 0 to year 1. By evaluating this integral, we can understand the net effect of the fish population growth and decline over the first year considering the given rate of change. Note: The specific numeric evaluation of the integral is not provided in the text and requires performing the integration process. However, the integral calculation would typically involve finding the antiderivative of \( P'(t) \) and then applying the limits from 0 to 1.
Expert Solution
Step 1

Calculus homework question answer, step 1, image 1

Step 2

Calculus homework question answer, step 2, image 1

steps

Step by step

Solved in 3 steps with 3 images

Blurred answer
Knowledge Booster
Application of Algebra
Learn more about
Need a deep-dive on the concept behind this application? Look no further. Learn more about this topic, calculus and related others by exploring similar questions and additional content below.
Recommended textbooks for you
Calculus: Early Transcendentals
Calculus
ISBN:
9781285741550
Author:
James Stewart
Publisher:
Cengage Learning
Thomas' Calculus (14th Edition)
Calculus
ISBN:
9780134438986
Author:
Joel R. Hass, Christopher E. Heil, Maurice D. Weir
Publisher:
PEARSON
Calculus: Early Transcendentals (3rd Edition)
Calculus
ISBN:
9780134763644
Author:
William L. Briggs, Lyle Cochran, Bernard Gillett, Eric Schulz
Publisher:
PEARSON
Calculus: Early Transcendentals
Calculus
ISBN:
9781319050740
Author:
Jon Rogawski, Colin Adams, Robert Franzosa
Publisher:
W. H. Freeman
Precalculus
Precalculus
Calculus
ISBN:
9780135189405
Author:
Michael Sullivan
Publisher:
PEARSON
Calculus: Early Transcendental Functions
Calculus
ISBN:
9781337552516
Author:
Ron Larson, Bruce H. Edwards
Publisher:
Cengage Learning