The half-wave rectifier in Figure 2–19 has a 250-μF filter capacitor and a 1.5-kOhm load. The ac source is 120 V rms with frequency 60 Hz. The voltage drop across the silicon diode is 0.7V. Assuming light loading, find (d) plot vin(t), vR(t) (output without the filter cap) and vL(t) (output with the filter cap) all on the same graph
The half-wave rectifier in Figure 2–19 has a 250-μF filter capacitor and a 1.5-kOhm load. The ac source is 120 V rms with frequency 60 Hz. The voltage drop across the silicon diode is 0.7V. Assuming light loading, find (d) plot vin(t), vR(t) (output without the filter cap) and vL(t) (output with the filter cap) all on the same graph

Related questions
Question
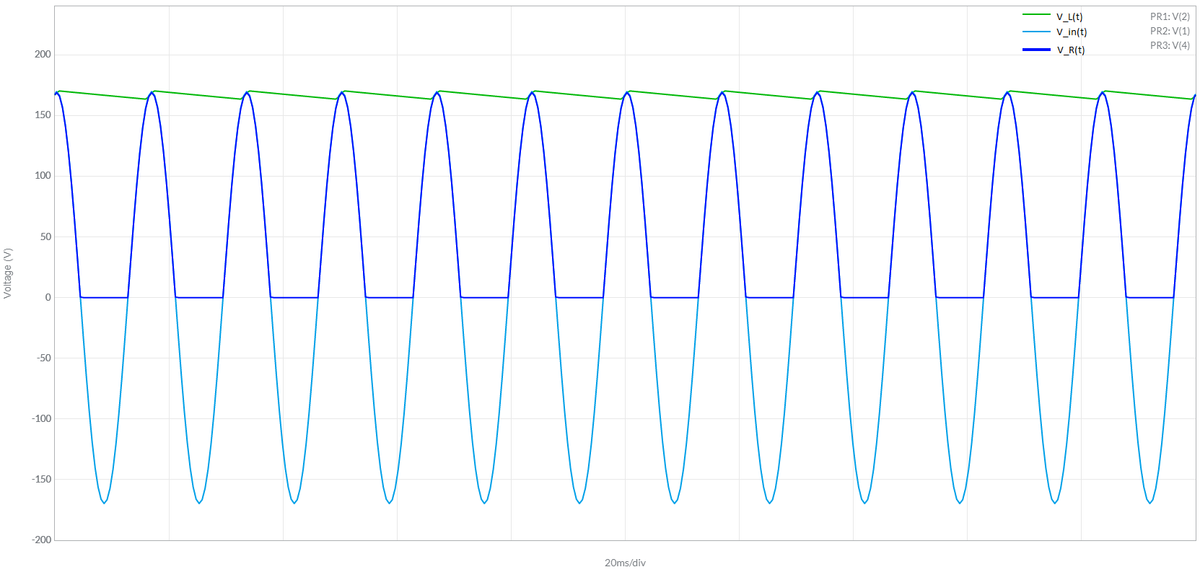
The half-wave rectifier in Figure 2–19 has a 250-μF filter capacitor and a 1.5-kOhm load. The ac source is 120 V rms with frequency 60 Hz. The voltage drop across the silicon diode is 0.7V. Assuming light loading, find
(d) plot vin(t), vR(t) (output without the filter cap) and vL(t) (output with the filter cap) all on the same graph

Transcribed Image Text:FIGURE 2-19 When load
vc(t) = vL(t)
resistance R, is connected
across the filter capacitor,
the capacitor charges and
discharges, creating a load
voltage that has a ripple
voltage superimposed on
a dc level.
v(t)
ripple voltage
VPR
Vpp Vdc
Vpr
waveform with
filter capacitor
disconnected
waveform with filter
capacitor and load
resistance connected
´discharge
(load)
charging
load resistance
current,
when input
pulses are
current,
Ewhen input
pulses are
e;
RL
present
absent
Expert Solution
Step 1

Step by step
Solved in 2 steps with 4 images
