The following table lists average high temperatures (° F) in January and in July for sélect in the United States: City Nashville Jan. hi. 45.9 July hi. 89.5 City Jan. hi 50.4 July hi. 88 Atlanta 60.8 90.6 Baltimore Boston 40.2 87.2 81.8 New Orleans 35.7 New York 37.6 85.2 82.6 Chicago Cleveland 29 83.7 37.9 Philadelphia Phoenix 105.9 82.6 89.3 31.9 82.4 65.9 Dallas Denver Detroit 54.1 96.5 33.7 Pittsburgh St. Louis 43.2 88.2 37.7 30 3
The following table lists average high temperatures (° F) in January and in July for sélect in the United States: City Nashville Jan. hi. 45.9 July hi. 89.5 City Jan. hi 50.4 July hi. 88 Atlanta 60.8 90.6 Baltimore Boston 40.2 87.2 81.8 New Orleans 35.7 New York 37.6 85.2 82.6 Chicago Cleveland 29 83.7 37.9 Philadelphia Phoenix 105.9 82.6 89.3 31.9 82.4 65.9 Dallas Denver Detroit 54.1 96.5 33.7 Pittsburgh St. Louis 43.2 88.2 37.7 30 3

MATLAB: An Introduction with Applications
6th Edition
ISBN:9781119256830
Author:Amos Gilat
Publisher:Amos Gilat
Chapter1: Starting With Matlab
Section: Chapter Questions
Problem 1P

Related questions
Question

Transcribed Image Text:The following table lists average high temperatures (°F) in January and in July for selected cities in the United States:
| City | Jan. hi | July hi |
|----------------|---------|---------|
| Atlanta | 50.4 | 88 |
| Baltimore | 40.2 | 87.2 |
| Boston | 35.7 | 81.8 |
| Chicago | 29 | 83.7 |
| Cleveland | 31.9 | 82.4 |
| Dallas | 54.1 | 96.5 |
| Denver | 43.2 | 88.2 |
| Detroit | 30.3 | 83.3 |
| Houston | 61 | 92.7 |
| Kansas City | 34.7 | 88.7 |
| Los Angeles | 65.7 | 75.3 |
| Miami | 75.2 | 89 |
| Minneapolis | 20.7 | 84 |
| Nashville | 45.9 | 89.5 |
| New Orleans | 60.8 | 90.6 |
| New York | 37.6 | 85.2 |
| Philadelphia | 37.9 | 82.6 |
| Phoenix | 65.9 | 105.9 |
| Pittsburgh | 33.7 | 82.6 |
| St. Louis | 37.7 | 89.3 |
| Salt Lake City | 36.4 | 92.2 |
| San Diego | 65.9 | 76.2 |
| San Francisco | 55.6 | 71.6 |
| Seattle | 45 | 75.2 |
| Washington | 42.3 | 88.5 |
**Question:**
Which dataset exhibits more dispersion: the January high temperature data or the July high temperature data? Explain your reasoning.
**Explanation:**
The dispersion of data refers to how spread out the data points are around the mean. In this context, it is useful to calculate measures of dispersion such as
Expert Solution
Step 1
Dispersion:
The one of the best measure of dispersion is standard deviation.
If the standard deviation is high, then the data set exhibits more dispersion.
If the standard deviation is small, then the data set exhibits less dispersion.
Consider, the standard deviations for Jan hi and July hi data.
Excel Procedure:
Enter Jan hi and July hi data in Excel>Data>Data Analysis>Select ‘descriptive statistics’>Select Jan hi and July hi under ‘Variable Range’> summary statistics>‘OK’.
Excel Output:
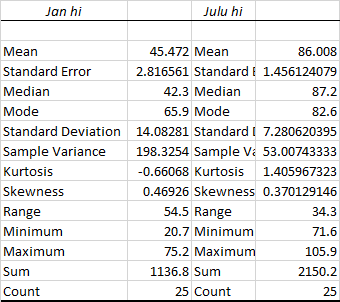
From the output,
The standard deviation of Jan hi is 14.0828.
The standard deviation of July hi is 7.2806.

Step by step
Solved in 2 steps with 1 images

Recommended textbooks for you
MATLAB: An Introduction with Applications
Statistics
ISBN:
9781119256830
Author:
Amos Gilat
Publisher:
John Wiley & Sons Inc

Probability and Statistics for Engineering and th…
Statistics
ISBN:
9781305251809
Author:
Jay L. Devore
Publisher:
Cengage Learning

Statistics for The Behavioral Sciences (MindTap C…
Statistics
ISBN:
9781305504912
Author:
Frederick J Gravetter, Larry B. Wallnau
Publisher:
Cengage Learning
MATLAB: An Introduction with Applications
Statistics
ISBN:
9781119256830
Author:
Amos Gilat
Publisher:
John Wiley & Sons Inc
Probability and Statistics for Engineering and th…
Statistics
ISBN:
9781305251809
Author:
Jay L. Devore
Publisher:
Cengage Learning
Statistics for The Behavioral Sciences (MindTap C…
Statistics
ISBN:
9781305504912
Author:
Frederick J Gravetter, Larry B. Wallnau
Publisher:
Cengage Learning

Elementary Statistics: Picturing the World (7th E…
Statistics
ISBN:
9780134683416
Author:
Ron Larson, Betsy Farber
Publisher:
PEARSON

The Basic Practice of Statistics
Statistics
ISBN:
9781319042578
Author:
David S. Moore, William I. Notz, Michael A. Fligner
Publisher:
W. H. Freeman

Introduction to the Practice of Statistics
Statistics
ISBN:
9781319013387
Author:
David S. Moore, George P. McCabe, Bruce A. Craig
Publisher:
W. H. Freeman